There haven’t been many places to hide during this year’s stock market correction (bear market?).
And one of the last hiding places could be in trouble: Energy stocks. And more specifically, the Oil and Gas Exploration Sector ETF (XOP) and the Oil Services ETF (OIH).
In today’s chart 2-pack, we look at $XOP and $OIH and highlight why they are trading at key junctures.
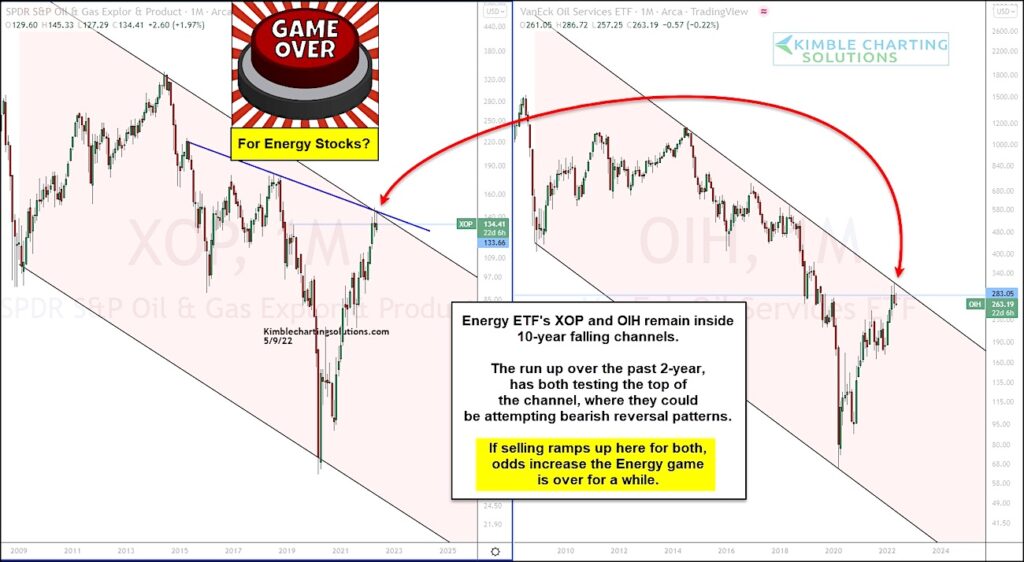
As you can see in the charts below, both ETFs are trading within falling channels. And both ETFs are testing the upper end of the falling channel after big 2-year rallies. We can also see that both Oil ETFs have produced long topside wicks, warning of potential bearish reversal patterns.
If selling ramps up here for both, the odds increase that the Energy game is over for a while. And that would be bad news for investors hoping the market correction ends soon. Stay tuned!
$XOP Oil and Gas Exploration ETF and $OIH Oil Services ETF Chart
Note that KimbleCharting is offering a 2 week Free trial to See It Market readers. Just send me an email to services@kimblechartingsolutions.com for details to get set up.
Twitter: @KimbleCharting
Any opinions expressed herein are solely those of the author, and do not in any way represent the views or opinions of any other person or entity.

 Testing Important Price Support")
: Cup (and Maybe Handle) Watch")

