Stock Market Futures Considerations For August 22, 2017
The S&P 500 (INDEXSP:.INX) is pointing higher this morning as traders as the bounce pushes higher. Key futures trading levels for the S&P 500, Nasdaq, and crude oil are located below.
Check out today’s economic calendar with a full rundown of releases. And note that the charts below are from our premium service and shared exclusively with See It Market readers.
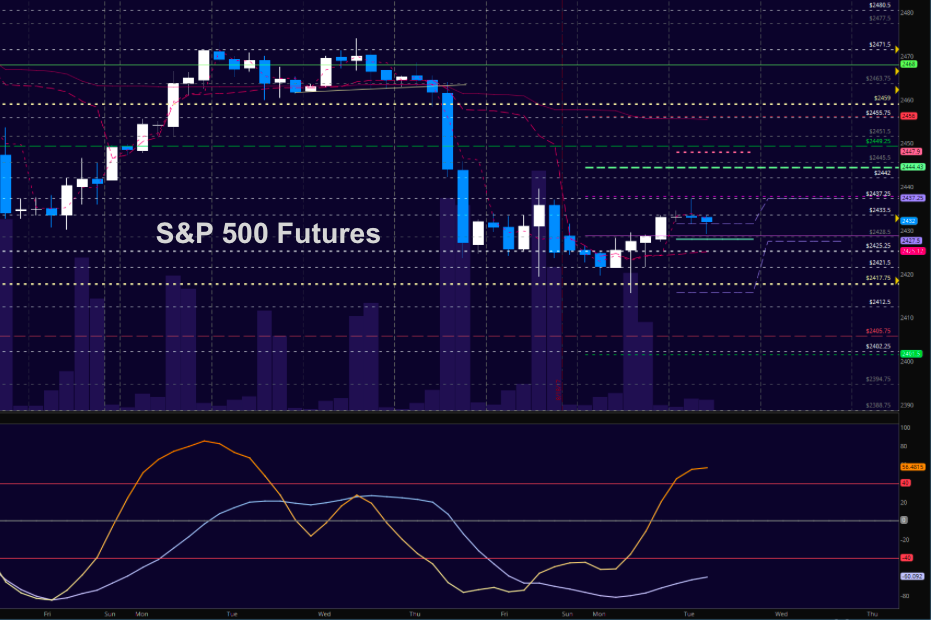
S&P 500 Futures (ES)
Buyers recaptured the region below 2420 and now traders battle to breach 2437.25. A breach above this level sends us through the low profile of volume The bullets below represent the likely shift of trading momentum at the positive or failed retests at the levels noted. The bullets below represent the likely shift of intraday trading momentum at the positive or failed tests at the levels noted.
- Buying pressure intradaywill likely strengthen above a positive retest of 2437.5
- Selling pressure intraday will likely strengthen with a failed retest of 2420
- Resistance sits near 2437.5 to 2443.5, with 2451.25 and 2459 above that.
- Support holds between 2425 and 2420.5, with 2417.5 and 2407.75 below that.
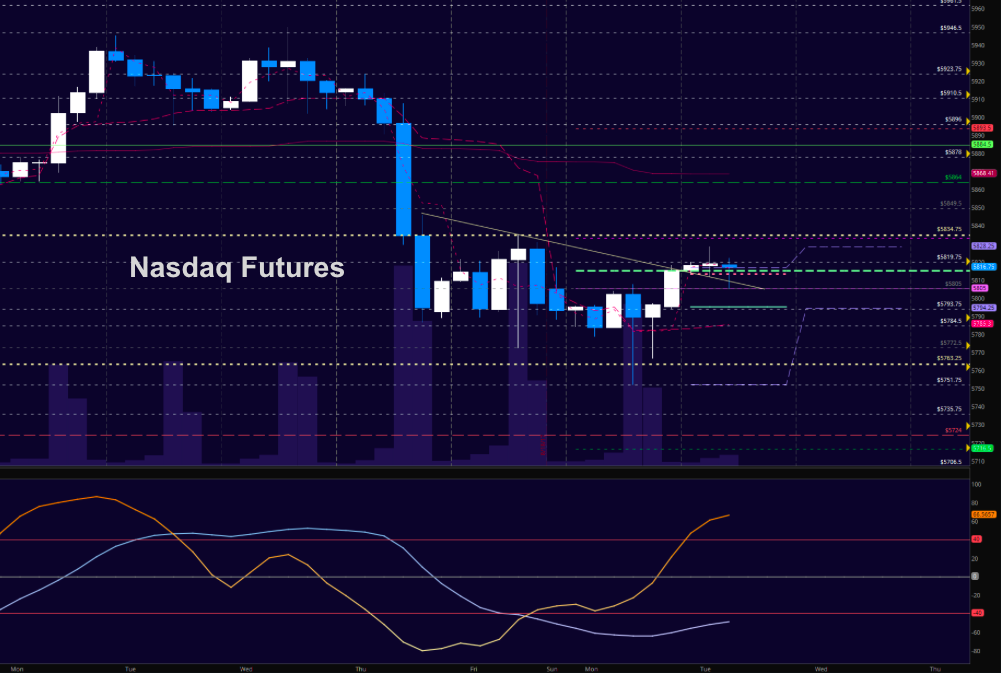
NASDAQ Futures (NQ)
Supports are holding but sellers still hold us below a critical region near 5834.75. We are still range bound with crosscurrents, but the hold of higher lows suggest that our pullbacks will find buyers. Resistance is now 5835 for the sellers to hold. Above there, and we run to the north into low volume regions. Momentum is now positive. The bullets below represent the likely shift of intraday trading momentum at the positive or failed tests at the levels noted.
- Buying pressure intraday will likely strengthen with a positive retest of 5834.75
- Selling pressure intraday will likely strengthen with a failed retest of 5784.5
- Resistance sits near 5834.75 to 5849.75, with 5864.5 and 5878.5 above that.
- Support holds between 5805 and 5793.5, with 5778.75 and 5763.5 below that.
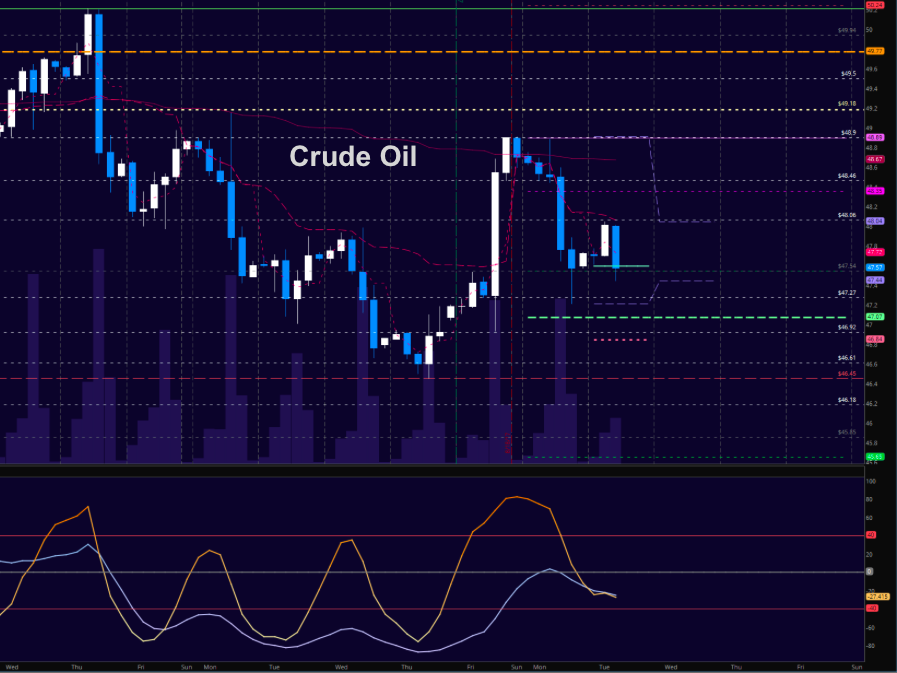
WTI Crude Oil
Deeper support tests still give us higher lows in the current mixed formation but bounces are very likely to find sellers into the API report after the close. The bullets below represent the likely shift of trading momentum at the positive or failed tests at the levels noted.
- Buyingpressure intraday will likely strengthen with a positive retest of 48.11
- Sellingpressure intraday will strengthen with a failed retest of 46.9
- Resistance sits near 48.46 to 48.9, with 49.18 and 49.87 above that.
- Support holds between 47.42 to 47.21, with 47.06 and 46.46 below that.
If you’re interested in the live trading room, it is now primarily stock market futures content, though we do track heavily traded stocks and their likely daily trajectories as well – we begin at 9am with a morning report and likely chart movements along with trade setups for the day.
As long as the trader keeps himself aware of support and resistance levels, risk can be very adequately managed to play in either direction as bottom picking remains a behavior pattern that is developing with value buyers and speculative traders.
Twitter: @AnneMarieTrades
The author trades stock market futures every day and may have a position in mentioned securities at the time of publication. Any opinions expressed herein are solely those of the author, and do not in any way represent the views or opinions of any other person or entity.
: Creating Bullish Divergence?")


 and Semiconductors (SMH): Concerning Price Pattern?")


