The ongoing China/U.S. trade war certainly provides a glimpse into the market’s confidence.
One day there is a tweet or statement that raises the temperature of the rhetoric and the markets drop. On another day the news statement is more positive, and the markets rise.
This is all noise – trying to guess which direction the next series of tweets are pointed is really not time well spent.
There is always noise in the market that can move things on a short-term basis. But underneath the noise there are fundamentals like economic data and earnings that, in the end, will matter much more than the tweet-driven market gyrations. Adiós tweets – let’s talk fundamentals!
Starting with the U.S. corporate earnings season, it’s not too shabby.
With about 90% of S&P 500 constituents having reported, corporate earnings growth appears to be contracting by only 1%, which would be the first drop in earnings since the economic soft patch of 2015/16.
Negative earnings growth is not a positive market event, as markets would certainly prefer growth. However, it’s worth noting that earnings are actually rising for most companies and the declines are mostly concentrated in Energy and Materials, two sectors that are more sensitive to global economic growth.
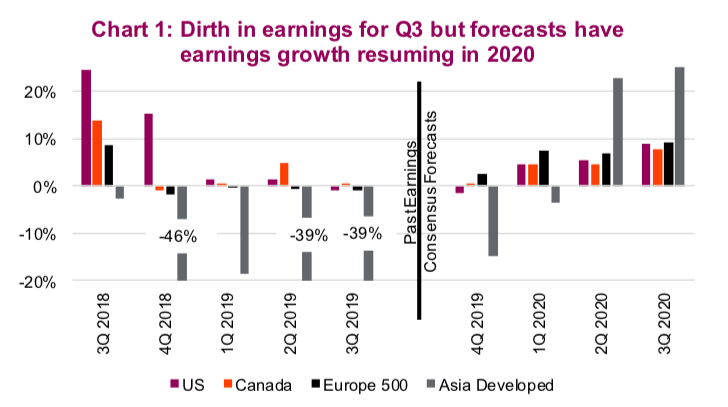
This trend in falling earnings growth is not just a U.S. story. In Western Europe, equities are tracking earnings growth of a negligible 0.6% with Energy and Materials being the two biggest drags. In developed Asia, earnings dropped substantially in the third quarter, by 39%, with Energy, Materials and Industrials dragging markets lower. This should not come as too much of a surprise – global economic growth has been slowing and this certainly weighs on some markets and some sectors more than others.
The current global soft patch in economic data has certainly translated into lower earnings growth, in some regions dipping into negative territory. That being said, consensus estimates point to gradual improvement in the quarters ahead. Chart 1 above depicts bottom-up earnings growth by region over the past few quarters and consensus estimates for the next four quarters. While forecasts can change, the baseline estimates point to a rosier earnings environment for 2020.
Turning our attention to the U.S. equity market, 2019 is gradually turning into the year that margins take a bit of a hit. From Q1 to Q3, sales or top-line revenue has continued to grow at a low single-digit pace, but remains positive.
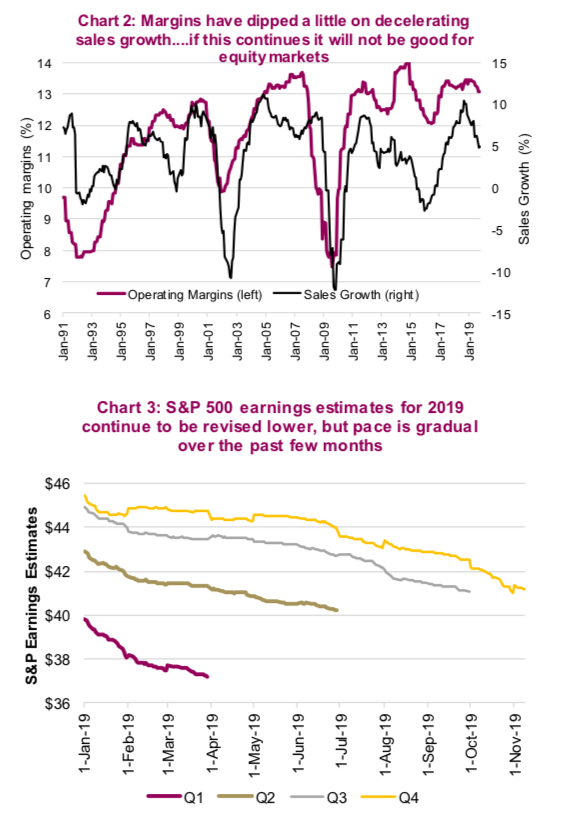
While slow, this sales growth has been greater than earnings growth in the past three quarters and by definition when sales growth is higher than earnings growth, that means lower profit margins. The pull back in margins has been relatively muted so far: S&P 500 profit margins have fallen from near-cycle-high levels of 13.5% to 13.1%. At the company level, this latest earnings season has seen 48% of companies report rising margins, compared with 52% announcing flat or falling margins. This is nothing to get too excited about yet, but if sales growth slows more amid slower global growth, this trend will likely accelerate. And there is a reasonably strong correlation between changes in margins and the direction of the S&P 500.
Forecasting earnings is not an easy task for analysts and given slower growth, the trend has been to reduce estimates over time. These negative revisions were very strong in Q1 as analysts updated views of a slower growth world with added trade tensions. Estimates for Q1 earnings almost dropped $3 from $40 to $37.20. Downward earnings revisions continued in the subsequent quarters but not at nearly the same pace.
For instance, Q3 earnings estimates dropped only slightly from $42.80 to $41.10 before the current earnings season got underway. And with positive earnings surprises for almost 80% of companies that have reported (historically high), the situation will likely come in a bit better when all is said and done. The aggregate surprise amount is an increase of 4.7%, a healthy margin of companies exceeding lowered analyst expectations. If negative revisions remain muted into 2020, this should help support the view that earnings growth may return to positive territory next year.
Valuations to guide your expected market returns
All this talk of earnings is nice but it also matters what you pay for a dollar of earnings. Sometimes the market is more expensive, sometimes it’s cheaper, and this usually depends on the economy, growth, risks and overall investor sentiment.
While these factors can easily paint a narrative for the markets, either bullish or bearish, the important lesson of history is that valuations will see a mean reversion. Expensive markets, measured by their price-to-earnings ratio, can remain expensive for some time, but sooner or later they will not be expensive. Similarily, markets can be cheap for quarters or years and then they revert to not being cheap. As a result, current valuations can provide guidance on expected market returns.
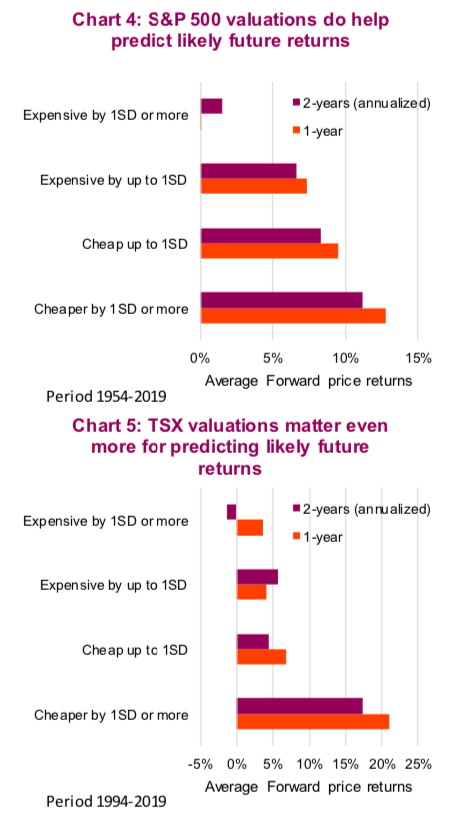
Some markets are slightly expensive at the moment, namely the U.S. equity market. For the S&P 500, which has longer data, we broke future price returns down based on valuations. For instance, when the S&P 500 price-to-earnings ratio (PE) was below one full standard deviation from the median, the historical one- and two-year price returns were 13% and 11% (annualized), respectively. Conversely, when valuations were greater than one full standard deviation above the median PE, the average forward return was 0% and 2% (Chart 4).
The impact of valuations on average future returns is evident in Canada as well. While we don’t have as long a history in Canada, we would caution comparing TSX and S&P returns on an apples to apples basis, but the trend appears to be the same. If markets are more than one standard deviation cheaper than their median, it is time to buy. If they are more expensive by more than one standard deviation, it is time to sell. Of course, nothing is that simple. This analysis uses averages and there are many different outcomes within each average that don’t conform. Still, valuations matter. Perhaps we should say ‘add’ or ‘trim’ vs buy or sell.
Conclusion
While the S&P 500 may be the more expensive market at the moment, its valuations are not overly stretched. Currently, it remains in the range above median, but not more than one full standard deviation above. It is getting close though. That being said, the TSX price-to-earnings ratio is below its median but not near a full deviation cheaper. Europe and international markets are cheaper as well. We are not saying the valuation spread is enough to make a rash move, but trimming those assets that are expensive and buying the less-loved cheaper markets would be a reasonable trade in our opinion.
Twitter: @ConnectedWealth
Any opinions expressed herein are solely those of the authors, and do not in any way represent the views or opinions of any other person or entity.

: Worrisome to Broader Market?")
