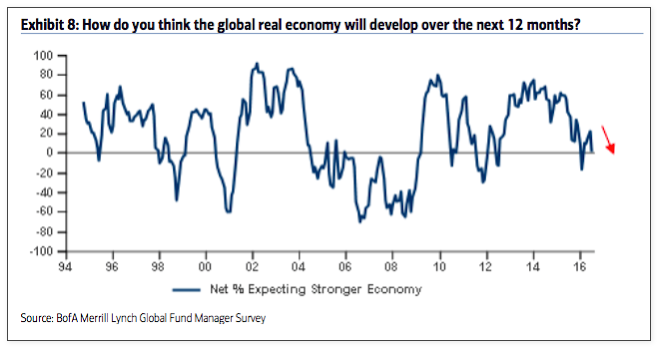
In February, 16% of fund managers expected a weaker economy in the next 12 months, the lowest since December 2011. Investors are still pessimistic, with only 2% expecting a stronger economy in the next year. This explains the low allocations to equities and high allocations to cash.
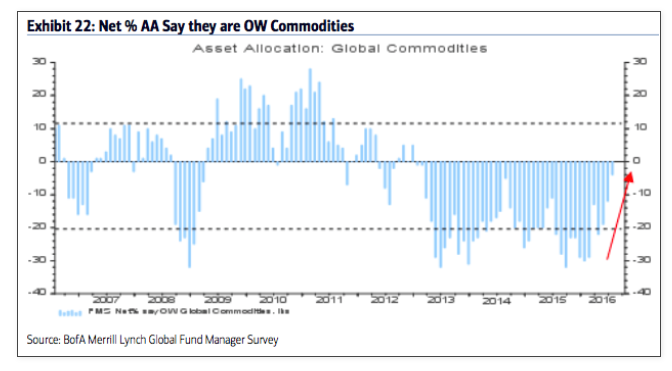
Commodities: Allocations to commodities improved to a 3.5 year high at -4% underweight. This is neutral relative to the long term mean. In comparison, in February, allocations were near one of the lowest levels in the survey’s history (-29% underweight). The improvement in commodity allocations goes together with that for emerging markets.
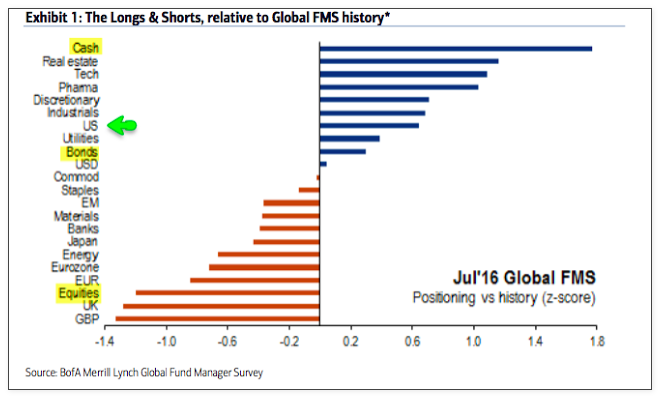
Sectors: Relative to history, managers are extremely overweight cash. They are far more overweight bonds than equities. Overall, this is very defensive positioning.
Fund managers risk appetite is the lowest since July 2012, a level from which SPX rose 10% over the following two months.
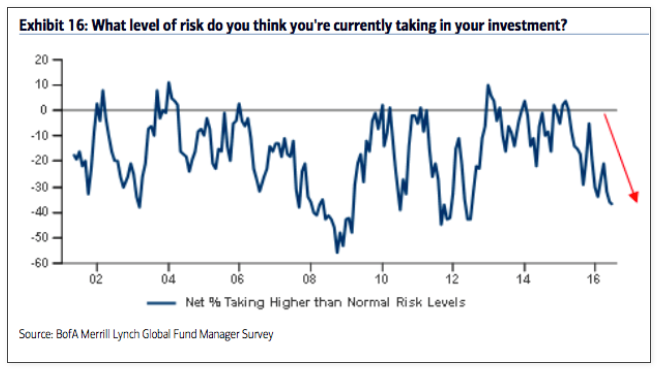
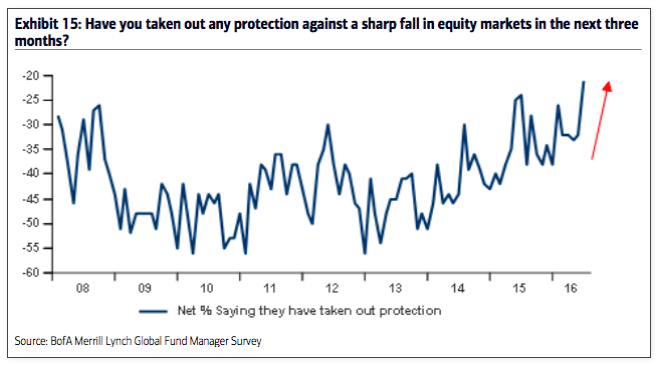
A record percent of fund managers have bought downside protection for the next 3 months.
Survey summary details are below.
- Cash (5.8%): Cash balances increased to 5.8% from 5.7%. This is higher than in February (5.6%) and the highest since November 2001. Typical range is 3.5-5%. BAML has a 4.5% contrarian buy level but we consider over 5% to be a better signal. More on this indicator here.
- Equities (-1%): A net -1% are underweight global equities, down from +1% in June and below the +5% overweight in February. Over +50% is bearish. A washout low (bullish) is under +15%. More on this indicator here.
- Regions:
- US (+9%): Exposure to the US Equities rose from -15% underweight in May to +5% overweight in July; this is the first overweight for the US in 17 months.
- Europe (-4%): Exposure to European Equities dropped from +26% overweight in June to -4% underweight. This is the first underweight for Europe in 3 years.
- Japan (-7%): Exposure to Japanese Equities was unchanged at -7% underweight. Funds were -20% underweight in December 2012 when the Japanese rally began.
- EM (+10%): Exposure to EM Equities rose from +6% overweight in June to +10% overweight in July – a 22-month high. Exposure was -33% underweight in January when the regional rally began. -34% underweight in September 2015 was the lowest in the survey’s history.
- Bonds (-35%): A net -35% are underweight bonds, a rise from -64% in December but unchanged from-34% in June. This is near a 3.5 year high allocation. Note that global bonds started to underperform in mid-2010, 2011 and 2012 when they reached -20% underweight.
- Commodities (-4%): A net -4% are underweight commodities – a 3.5 year high – an improvement from -12% last month. Higher commodity exposure goes in hand with improved sentiment towards EM.
- Macro: Just 2% expect a stronger global economy over the next 12 months; in February, 16% expected a weaker economy, the most pessimistic since December 2011.
Thanks for reading.
Twitter: @ukarlewitz
Read more from Urban’s Fat Pitch Blog
Any opinions expressed herein are solely those of the author, and do not in any way represent the views or opinions of any other person or entity.

: Showing Some Signs of Emerging Strength")
