Just last evening, I shared a chart of the Russell 2000 ETF (NYSEARCA: IWM).
The small cap index was attempting to put in a higher low vs last week… as well as a higher low versus the October 29 low.
Though the small caps have traded “heavier” than other broad indexes, it’s a familiar pattern.
The broad indexes were all trading above the late October lows as of yesterday’s close.
This type of pattern can go one of two ways: A swift rally higher, or a strong push to test the lows (or make new lows). The former happens when there is still some lingering fear… the latter occurs when there is too much complacency from the bounce.
We’re seeing the latter today.
Here’s my tweet (and chart) from last night. Then we’ll discuss the action from today.
$IWM Russell 2000… higher low or death cross destruction? #IBDpartner
Keep an eye on interest rates and the US Dollar. @IBDinvestors –> https://t.co/AtORciY9S6 pic.twitter.com/O7AanjDJxO
— Andy Nyquist (@andrewnyquist) November 20, 2018
Risk happens fast…
Fast forward to today, and it’s easy to see how quickly the dynamic can change in less than 24 hours in a corrective environment.
Note that the MarketSmith charts (above and below) were built with Investors Business Daily’s product suite. I am an Investors Business Daily (IBD) partner and promote the use of their products – you can gain access here. It’s a great platform with a good mix of technical and fundamental data.
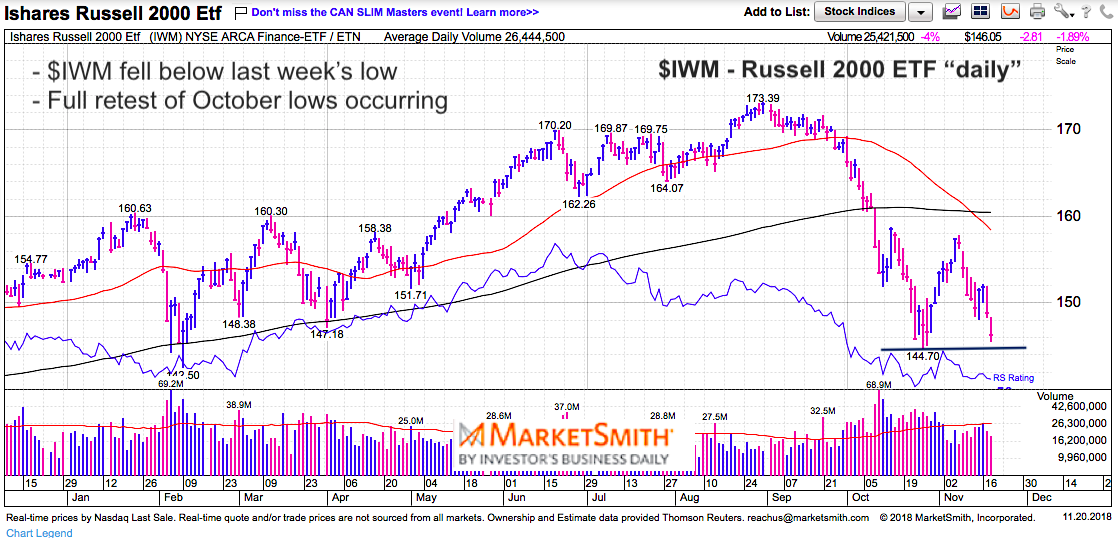
The Russell 2000 sliced through last week’s lows and came within a half percent of its October lows. As well, the S&P 500 came within a percent of its lows and the Nasdaq made new lows. The Nasdaq is arguably the weakest of the bunch at present.
Momentum indicators for the Russell 2000 are well off the lows, so perhaps a new “price” low would form a divergence. Though a bottoming pattern, it’s worth noting that divergences can last longer than one expects… and some do not work at all.
The “death cross” of the 50 day moving average down through the 200 day moving average isn’t as important as the sheer fact that the 50 day is declining. Any sharp rallies will need time to backtest and back/fill before any all clear bottom can be made. Trade safe.
Below is an updated Russell 2000 chart.
Twitter: @andrewnyquist
The author has long exposure to $SPY and $DIA at the time of publication. Any opinions expressed herein are solely those of the author, and do not in any way represent the views or opinions of any other person or entity.

: Showing Some Signs of Emerging Strength")
