Banks and Financial stocks used to be major indicators of the domestic economy. But as commerce turned global, the indication came with a broader footprint.
Nonetheless, they are a relevant sector and quite tradable via the Financial Sector ETF (XLF).
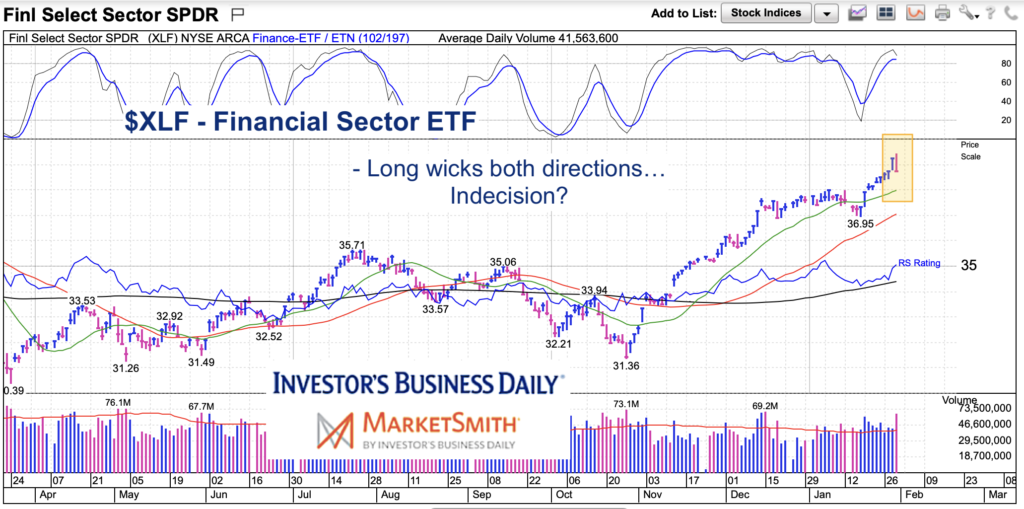
The financials have been one of a handful of market-leading sectors and the recent rally has been impressive. That said, today’s chart highlights some recent indecision that should give traders and active investors some pause.
Note that the following MarketSmith charts are built with Investors Business Daily’s product suite.
I am an Investors Business Daily (IBD) partner and promote the use of their products. The entire platform offers a good mix of tools, education, and technical and fundamental data.
$XLF Financial Sector ETF Chart
So what signals indecision? How about back to back days where the price action creates long wicks in opposite directions. You can see this in the shaded area below. Price opened high, traded lower, then closed high. Then price opened lower, traded higher, before closer lower. Net gain of those to days was close to zero. That’s indecision and gives reason for active investors to mind positioning here.
Twitter: @andrewnyquist
The author may have a position in mentioned securities at the time of publication. Any opinions expressed herein are solely those of the author, and do not in any way represent the views or opinions of any other person or entity.
: Creating Bullish Divergence?")

 and Semiconductors (SMH): Concerning Price Pattern?")


: Creating Bullish Divergence?")