Today’s One Chart is the Financial Sector SPDR ETF (XLF), in a follow-up to our post in early June on the confluence of resistance levels.
As we will discuss in this article, the XLF is displaying a similar combination of factors, all suggesting weaker prices and likely underperformance as the sector continues to struggle.
Our observation in June, as the S&P 500 was reaching its own short-term peak, was that the Financial sector had retraced 61.8% of its February to March downtrend. This was after the XLF had previously found resistance at the 38.2% level in April.
The price had gapped just above a descending 200-day moving average and closed right back below this key long-term barometer. Soon after, the XLF began a short-term slide that eventually pushed the price down to the 38.2% level around $22.50.
Over the next four to five weeks, the XLF slowly appreciated while the relative strength remained muted.
This shows that while the Financial sector had underperformed coming out of the June highs, the sector kept pace with the broader equity markets into early August.
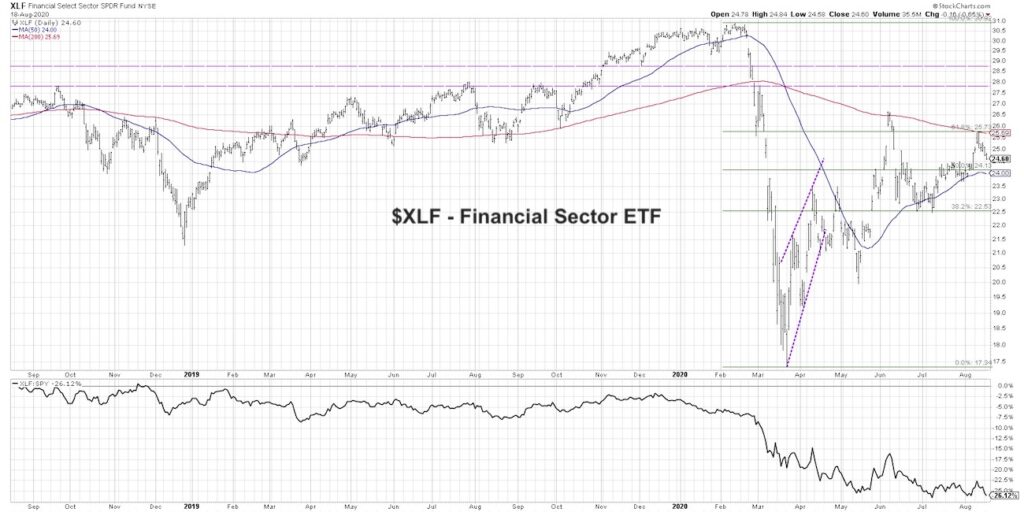
Now we see a very similar combination of inputs to what occurred in early June. The price has once again reached the 61.8% level which now coincides almost perfectly with the declining 200-day moving average. Combine this with the fact that the XLF failed at similar levels in June, and you have a high probability of further downside from current levels.
The most likely scenario is the XLF returns back to support around $22.50 with the relative strength achieving a new 52-week low, while other sectors remain closer to current price levels.
What would tell me this thesis is incorrect?
If the XLF is able to remain above its 50-day moving average, which served as support at the end of July, then this may indicate limited downside due to increased buying power. If and when the price is able to finally eclipse the key resistance around $26, that would signal an end to the bearish thesis and indicate high potential for further upside.
Having said that, it seems the most likely outcome is that the Financials remain relatively weak as other sectors like Technology and Communication Services continue to see high demand from investors.
To see this article in video format, check out my YouTube channel!
Twitter: @DKellerCMT
The author may have a position in mentioned securities at the time of publication. Any opinions expressed herein are solely those of the author, and do not in any way represent the views or opinions of any other person or entity.

: Showing Some Signs of Emerging Strength")

