In “Passive Negligence”, we highlighted how investors, on the margin, have been shifting from an active investment style to a more passive approach by favoring index and sector ETFs and mutual funds over individual holdings. We raised a concern that, in this mad dash towards the latest fad, many investors are falling prey to complacency by failing to properly analyze the underlying companies in which they are ultimately investing.
This behavior may be giving a boost to the Russell 2000 Index (INDEXRUSSELL:RUT) as well.
Since Donald Trump won the election, the Russell 2000 (R2K) has been the darling of the market, increasing approximately 15%. There are many narratives that support investing in small cap stocks, as represented by the R2K, and some even have credence. That said, investors should look beyond these narratives and analyze the index’s current valuation and its underlying holdings to better judge if the Russell 2000 is a good investment.
This article was written in conjunction with J. Brett Freeze, CFA from Global Technical Analysis.
The Russell 2000
Passive investors looking to diversify their equity holdings frequently hold a number of ETFs and mutual funds that blindly follow an index or sector. Many investment professionals employ a similar approach called “closet indexing”. In other words, they own a portfolio of different equity indices and some specific sectors as a decoy to their clients. They want the appearance of providing real value by generating alpha through security selection and not simply buying the “market”. Typically such strategies, over time, provide market-like returns and little diversification.
The Russell 2000, in the words of Wikipedia, is “by far the most common benchmark for mutual funds that identify themselves as small cap”. Therefore, the R2K is a favorite among “closet indexers” looking to diversify their portfolios with small-cap holdings.
Like many broad-based indices, the Russell 2000 (R2K) is composed of a diverse group of companies from varying industries. Currently, technology, services, healthcare and financials account for approximately 75% of the market capitalization of the index.
The following aggregate analysis of the R2K decomposes the index into nine industry classifications as well as a small catch-all category for unclassified companies. The current index constituents were held constant over the 13 year period that we reviewed. In other words, the data analyzed assumes the companies currently in the R2K, were in it for the last 13 years. This method allows for a more consistent evaluation of the index as it is currently composed. Note that 34 of the index constituents were excluded from this analysis as no data was available. The data used in this analysis is courtesy of www.gurufocus.com.
Net Income
Over the last five years, the Russell 2000’s aggregate annual net income has shrunk from $33.6 billion to $9.7 billion, a 73% decline. That compares with nominal GDP growth of +18% and a 1% decline in S&P 500 earnings growth over the same period. Of the nine industries and the catch-all category that comprise the R2K, only four have experienced income growth over the last five years. Even more interesting is that 83% of the R2K’s earnings growth over the last five years is from one sector, financials. Exclude financial companies from the index, aggregate earnings have been negative in each of the last two years. The chart below highlights the declining trend in R2K earnings since 2003, which marks the start of the market’s recovery from the Technology crash.
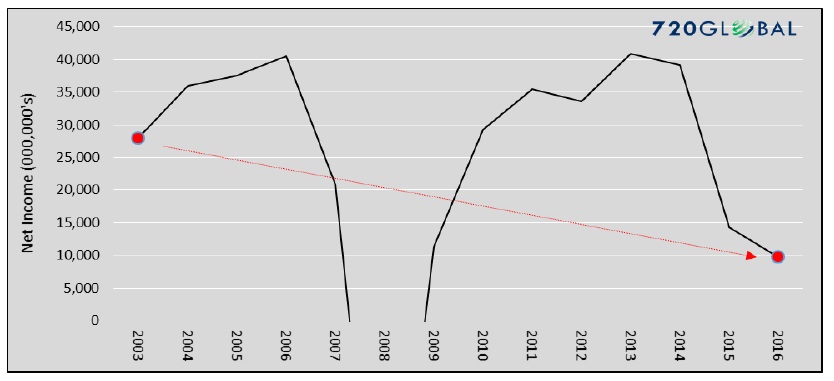
Russell 2000 earnings, as highlighted above, have declined at an annualized rate of 7.81% despite the 4.15% annualized earnings growth of financial companies.
Market Capitalization
Market Capitalization, also known as market cap, is the aggregate value of the equity shares underlying the index at a specific point in time. Currently, the R2K’s market cap stands at $2.311 trillion. Financial companies comprise the largest share at 25.4%, followed by technology (17.5%) and services (16.8%). Over the last five years, as shown in the graph below, the market cap of the R2K has nearly doubled, rising 91% despite declining earnings over the same period.
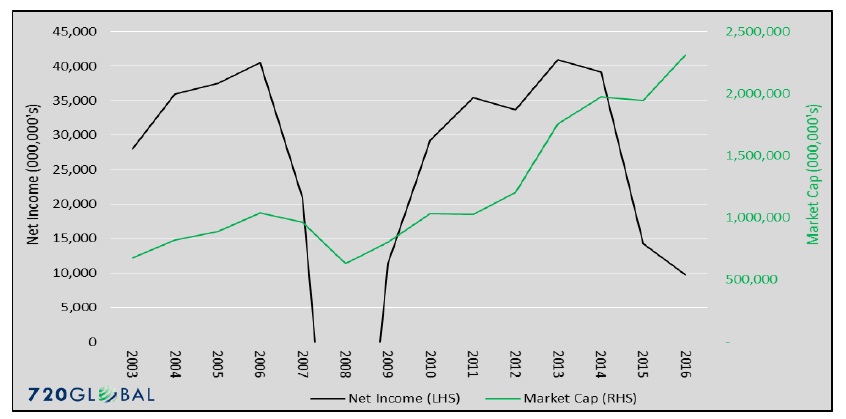
As the R2K’s market cap steadily increases and earnings fail to follow, the valuation of the index naturally richens. In particular, note the last two years in which the market cap increased despite a sharp decline in earnings.
Currently, the ratio of market cap to net income is at an astronomical 237x, significantly above the post-2003 average of 33x. Holding earnings constant and regressing the index back to its post-2003 mean market cap to earnings ratio would produce an 86% decline in the R2K. Even in an optimistic scenario, where earnings rebound to the high water mark of $40.90 billion set in 2013, the R2K would need to decline by 42% from its current level to produce a market cap to earnings ratio of 33x.
As a point of comparison, the widely reported P/E ratio of 46 for the R2K appears to be much lower than our value (237x). Unlike, the market benchmark S&P 500, the reported Russell P/E ratio excludes companies with negative earnings. Our analysis appropriately includes both positive and negative earnings.
What is the Russell?
Thus far, we have shown the paltry earnings growth of the R2K and the unsubstantiated rise in its market cap. To try to make more sense of this conflict we return to a point made earlier: financial companies have provided 83% of all the earnings in the R2K over the last five years. From a fundamental perspective, an investor in the R2K has relied almost entirely upon earnings from financial companies, but has retained exposure to three-quarters of the index which have produced negligible aggregate earnings. In other words, investors are paying a steep premium for what amounts to earnings exposure from financial stocks.
continue reading this article on the next page…


