Key Stock Market Takeaways – December 21:
Price and breadth trends remain lower, but near-term sentiment may be washed out enough to support a bounce. The lack of positive breadth divergences suggests the cyclical bear market is likely to persist into the first half of 2019. Elevated exposure to equities could weigh on future stock market returns.
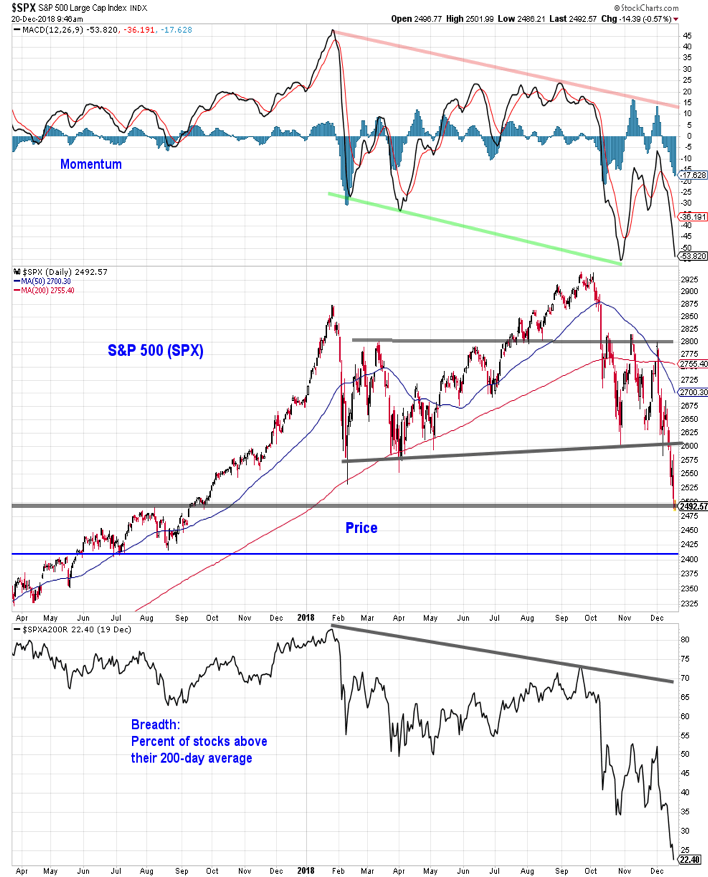
The S&P 500 (NYSEARCA: SPY) has moved to new 2018 lows in December, accompanied by new lows across multiple breadth indicators. Typically breadth bottoms ahead of price. The lack of positive breadth divergences as the S&P 500 Index tested support near 2500 is reason for a continued cautious approach.
In our 2019 Economic & Stock Market Outlook (Conditions in Place for Return of Cyclical Bull in 2019), we discuss some of the key developments to watch for as evidence that stocks are bottoming (or have done so already). While these conditions have not been meaningfully met, we do see some opportunity for stocks to rally off of support.
One of the important characteristics of a bear market (which is where we now seem to find ourselves) is that downside moves extend further than expected, while upside moves tend not to. We would watch for resistance near 2600.
One positive development on this S&P 500 chart is that momentum has not undercut the October lows even as price has deteriorated.
In addition to the positive divergence from a momentum perspective, short-term sentiment measures show some degree of being washed out. This is best represented by the NDR Trading Sentiment Composite. While excessive pessimism alone may not cause stocks to rally, the presence of excessive pessimism could add fuel to any rally that does emerge. The Trading Sentiment Composite has moved to its lowest level since November 2016 and is in the zone that has accounted for all of the net gains in the S&P 500 over the past four years.
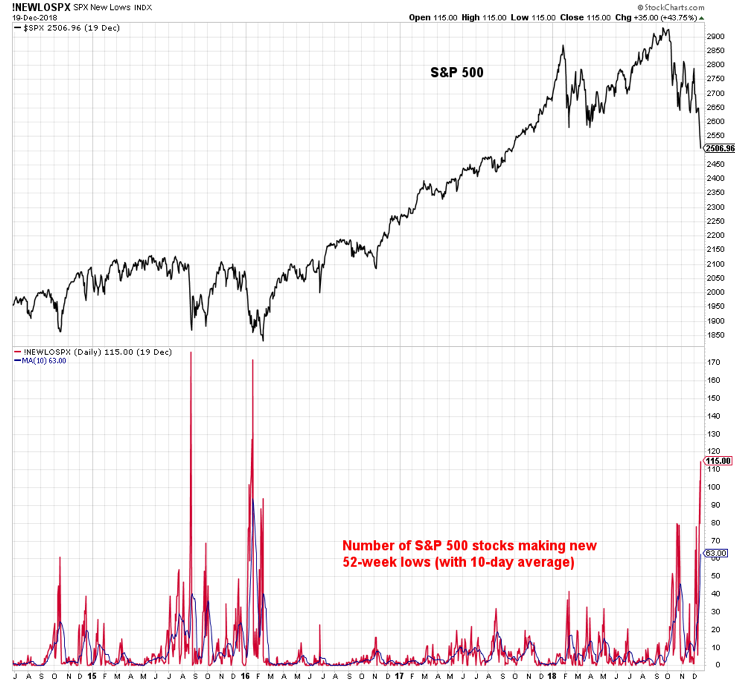
Even if stocks bounce from current levels, the lack of positive breadth divergences suggests at least a re-test (and perhaps another leg lower) before having confidence that the cyclical bear market has run its course. Not only have the percentage of stocks above their 200-day averages continued to move lower as the S&P 500 has made new lows, but the new low list for the index has continued to expand.
As stocks work through a bottoming process, these breadth indicators typically hold up better than the index itself. That has not been seen so far. One reason for this is that it may be premature to be looking for positive divergences. While the S&P 500 is 15% off its mid-year peak, the average non-recession cyclical bear market experiences a decline of 25%.
Every cyclical bear market is different, but there are some consistent themes. Cyclical bear markets associated with recessions tend to last longer and experience larger losses than cyclical bear markets not associated with recessions. The two most recent cyclical bear markets (2011 and 2015/16) occurred in an environment of quantitative easing and saw less-than-average declines).
With central banks now engaged in quantitative tightening (more than half of the world’s central banks are tightening monetary policy), it may be overly optimistic to expect another historically muted cyclical bear market. The two cyclical bear markets of the 1960s (1962 and 1966) came in years with GDP growth above 4% yet still saw declines of more than 25%.
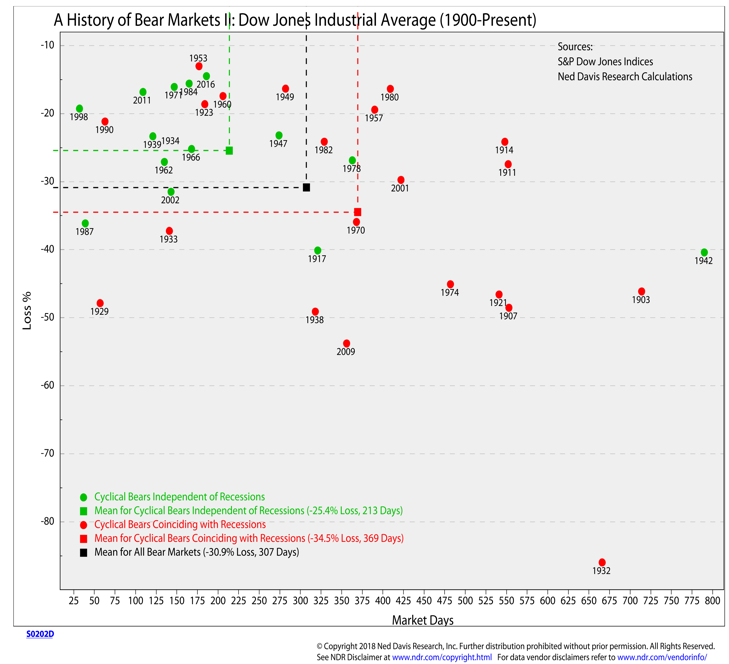
The impact of the shift over the past year from quantitative easing to quantitative tightening could amplify the current cyclical bear market, but with economic growth still on firm footing it is reasonable to expect it to run its course sometime in the first half of next year.
While that may set up stocks to move into the second half of the year with a cyclical tailwind (and perhaps a more favorable valuation backdrop), it may still be prudent to keep stock market return expectations somewhat muted. There is strong inverse correlation between household exposure to equities and forward stock market returns and as of the end of the third quarter of 2018, household equity exposure was at historically elevated levels.
Twitter: @WillieDelwiche
Any opinions expressed herein are solely those of the author, and do not in any way represent the views or opinions of any other person or entity.
: Creating Bullish Divergence?")


 and Semiconductors (SMH): Concerning Price Pattern?")


