The SPDR Euro Stoxx 50 ETF (NYSEARCA:FEZ) trades on average 9,427 options per day with 5,356 calls and 4,071 puts, but recently has seen some sizable positioning.
It began on 2/15 with 10,000 May $34 calls sold $1.41 in a spread that bought 30,000 August $37 calls at $0.49. The same structure of this trade took place on 2/22 as 20,000 May $34 calls traded $1.42 and 60,000 August $37 calls at $0.49 to $0.50 in a spread. The same trade took place on 2/27 with 20,000 May $34 calls at $1.65 and 60,000 August $37 calls at $0.58.
These 1X3 diagonal spreads are not common, so some strategist is seeing an opportunity.
Looking closer at the FEZ ETF we see the top weighted holdings are Total SA (NYSE:TOT), Anheuser-Busch (NYSE:BUD), Siemens AG, SAP (NYSE:SAP), Sanofi (NYSE:SNY), Bayer AG, BASF, Unilever (NYSE:UN), Daimler AG, and Allianz with those top 10 holdings accounting for nearly 38%. Financials are most heavily weighted at 18.9%, followed by Industrials at 14%, Consumer Staples at 13%, and Consumer Discretionary at 11.55%. France is weighted 35.8% which is interesting with the upcoming Elections in late April, followed by Germany at 32.85%. In terms of valuation, the ETF has a 3.88% dividend yields with a P/E at 14.4X and Price/Book of 1.5X.
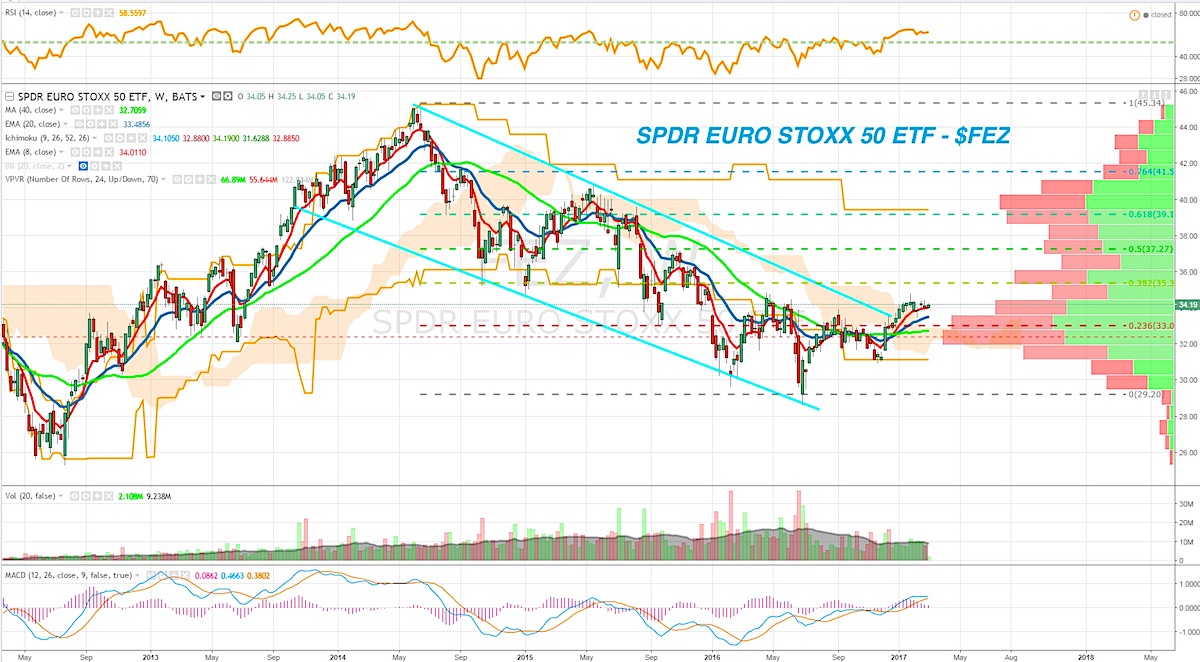
On the chart, FEZ peaked near $45 back in early 2014 and trended down for 3 years, but recently broke out of this downtrend and above its weekly cloud, a trend shift in progress. Weekly RSI has already broken out, nearing its highest level since 2014, and the $34.40 level key to clear a high volume bar with the 38.2% Fibonacci retracement at $35.35 and 50% at $37.30 two near term targets. In terms of a measured move out of this bottoming pattern, I think $39.50 is an appropriate upside target. Based on the options strategy the near-term upside may be minimal and $32.80 is an optimal entry level on weakness to position for strength in the second half of 2017.
Euro Stoxx 50 ETF (FEZ) Chart
Thanks for reading.
Read more of my research and options trading ideas over at OptionsHawk. Thanks for reading and have a great week!
Twitter: @OptionsHawk
The author does not have a position in mentioned securities at the time of publication. Any opinions expressed herein are solely those of the author, and do not in any way represent the views or opinions of any other person or entity.

: Showing Some Signs of Emerging Strength")

