The Euro (CURRENCY:EUR) has moved a bit higher than we anticipated in our June 16 post, but bears have a strong chance of countering the rally and taking the Euro currency to new lows.
In fact, the current Elliott wave pattern qualifies even better as a nearly completed correction now than it did in June.
This is just one of several interesting developments in the currency market. As an aside, the newsletter we’re putting together for next week will highlight some others in addition to featuring some timely analysis of grain markets. Request your copy of the newsletter here.
Charting the Euro Currency with Elliott Wave
On the monthly chart for the CurrencyShares Euro ETF (NYSEARCA:FXE), price is on the verge of testing the channel boundary – a classic characteristic of Elliott fourth-waves. Nearby are two Fibonacci resistance levels at 114.81 and 115.61, each calculated by a different method – extension and retracement.
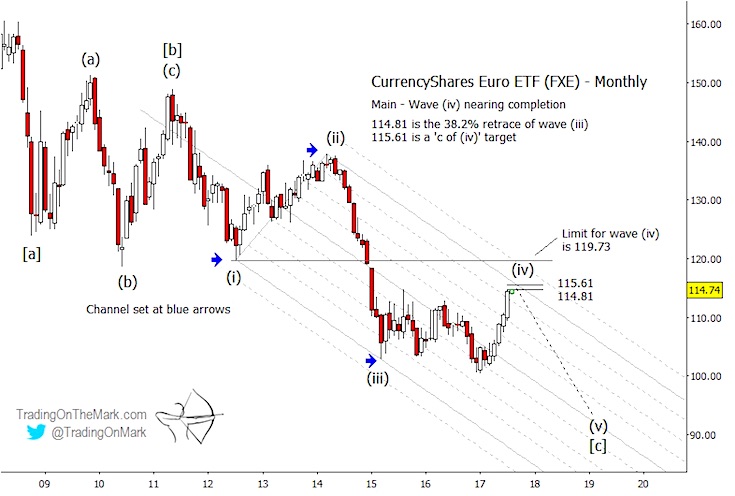
If wave (iv) is nearly complete, as we believe, then the Euro Currency ETF (FXE) should soon commence a fifth wave decline that will eventually reach beneath the areas tested at the start of the 2017. The absolute limit for a rally in this bearish scenario is where downward wave (i) found support five years ago at 119.73.
In addition to the chart above, there is a bullish alternate scenario we’re following that would allow the present rally to be the first part of a larger impulsive wave upward. One development that would move that scenario to the forefront would be for FXE to break above the 119.73 limit shown above. Another possibility for a bullish scenario would be for price to find resistance above the major channel boundary and then drift down to make a higher low sometime in 2018.
We’ll cover the bullish possibilities more extensively in our next newsletter. Be sure to reserve your copy and follow us on Twitter for more updates!
The author does not have a position in any of the mentioned securities at the time of publication. Any opinions expressed herein are solely those of the author, and do not in any way represent the views or opinions of any other person or entity.
ALSO READ: 5 Charts That Spell Trouble For Stocks


