The chart and data that follow highlight non-commercial commodity futures trading positions as of September 25, 2018. This data was released with the September 28, 2018 COT Report (Commitment of Traders).
Note that this chart also appeared on my blog.
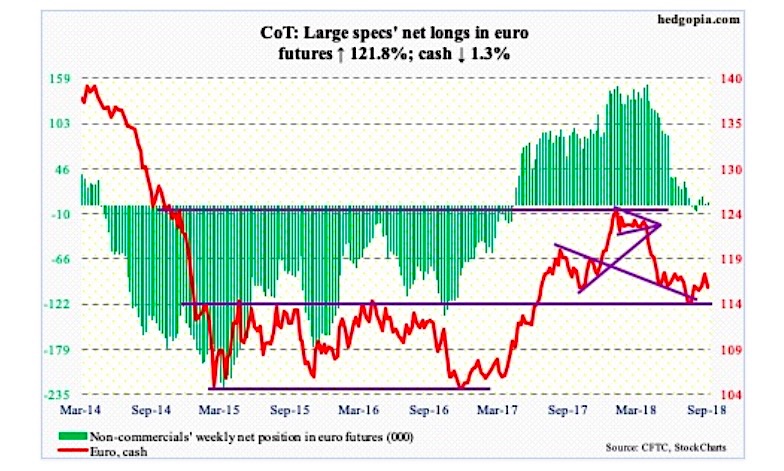
The chart below looks at non-commercial futures trading positions for Euro currency futures. For the week, the Euro finished down – 1.5%, with the CurrencyShares FX Euro ETF (NYSEARCA:FXE) closing down -1.2%.
Here’s a look at Euro currency futures speculative positioning. Scroll further down for commentary and analysis.
The Euro is trying to gain traction above key support – will this lead to continued stabilization and a rally? (see comments below).
Let’s look at the COT data and technical to see what’s next…
Euro Currency Futures: Currently net long 3.7k, up 2k.
The Euro had a rough week last week as traders digested news about budgets and Italy. Two shooting stars (bearish candlesticks) formed last week and guided the action lower. $118 has been a recent selling level and $118-119 is current resistance.
So where is support? Well, the 50 day moving average is just above $116 (or exactly where price closed on Friday). The lower Bollinger band (20,2) is around $115.33, so that may provide support as well. Note that $115 is a major support level that has formed over the past handful of years, so it’s worth watching. Have a great week!
Twitter: @hedgopia
Author may hold a position in mentioned securities at the time of publication. Any opinions expressed herein are solely those of the author, and do not in any way represent the views or opinions of any other person or entity.

: Cup (and Maybe Handle) Watch")
 Trading Near Top Of Price Range")

