Recently, I have been collaborating on a research project with Arun Chopra, an experienced investor and good friend who holds a CFA and CMT. Together, we have been blending longer-term fundamental indicators with technical indicators to do historical studies. Today, we look at the PE10 chart of S&P 500 equity valuations.
The PE10 is a equity valuation measure using real earnings over a 10 year period (Investopedia). Many of us have seen the line chart, but we wanted to look at where today’s equity valuations fell on the distribution of historical valuation periods.
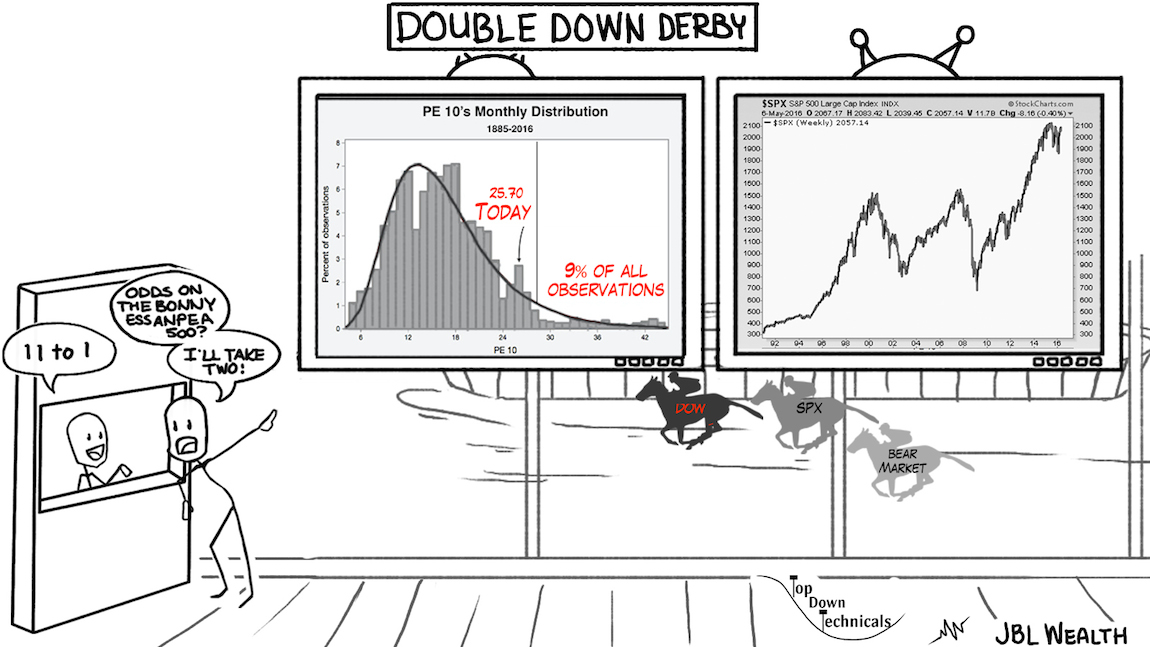
Here are some notes (reference the chart below):
- Today’s S&P 500 PE10 ratio is ~26
- Over 130 years, only 9% of ~1400 months, or ~130 months (11 years) have exhibited higher equity valuations
- Removing 1998-1999 (not shown in this chart race), only 6% of observations are more expensive than today
Given, those odds, how much are you betting?
Thanks for reading.
Thanks for reading and best of luck out there.
Further Reading: Surging Japanese Yen May Carry Consequences For Equities
Twitter: @JBL73
The authors may have positions in mentioned securities by the time of publication. Any opinions expressed herein are solely those of the author, and do not in any way represent the views or opinions of any other person or entity.


 Ready To Break Out?")
