The Energy Sector (NYSEARCA:XLE) has been hot of late for investors. The bulls have taken control and driven prices higher into December. But there may be reason to turn cautious here over the near-term.
Is a pullback for the energy sector on the horizon?
Timeframes are always important when defining risk. If you are a very short-term trader, then you may want to lock in some profits. If you are an intermediate or long-term investor, then you may want to manage around the position (adding/subtracting as necessary).
Below is an updated chart of the Energy Sector (XLE) through last week. Here are my thoughts:
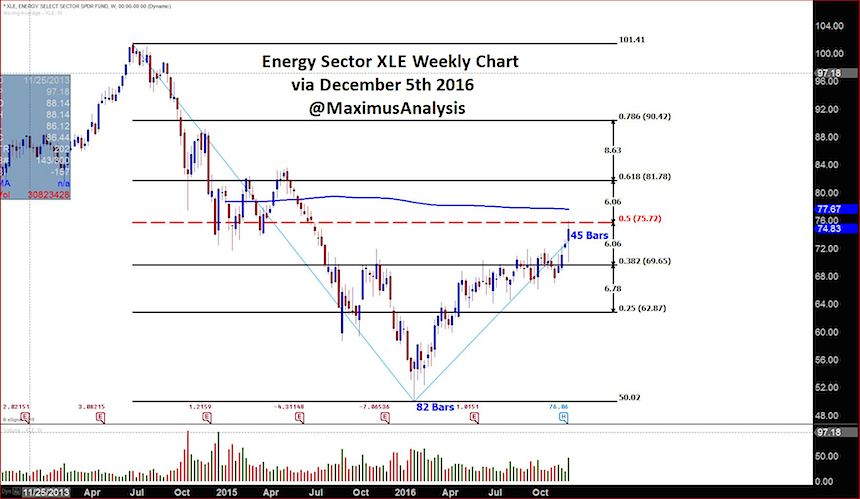
- The energy sector is now approaching the important 50% Fibonacci retracement level. Please note the time factor that is in play on this chart. The big swing lower took 82 weeks while the upward move is now at 45 weeks. This shows weakness due to the time factor percentage being above the price factor. The Energy Sector is also overbought and has seen huge volume this past week.
- Should the rally give way to a pullback, I’d watch the following:
- A price break below last week’s low of 70 and price targets are:
- 64.20
- 58.25
- 52.30
- A price break below last week’s low of 70 and price targets are:
The Energy Sector (XLE) Weekly Chart
Thanks for reading.
Twitter: @MaximusAnalysis
The author does not have a position in any of the mentioned securities at the time of publication. Any opinions expressed herein are solely those of the author, and do not in any way represent the views or opinions of any other person or entity.


: Showing Some Signs of Emerging Strength")
