It has been a wild ride for energy commodities in the last month. After a continuation of a dismal bear market into early 2016, including new price lows, energy market seasonality kicked in and aided a massive rally (note: it should be called a “bounce” but that wouldn’t do it respect when looking at the percentages).
Crude Oil prices climbed 41%, Gasoline prices moved higher by 53%, while Natural Gas prices lost 9%.
February and March are typically bullish months for all three of these commodities. So as that window of energy market seasonality nears an end, let’s catch up on the energy sector and commodities.
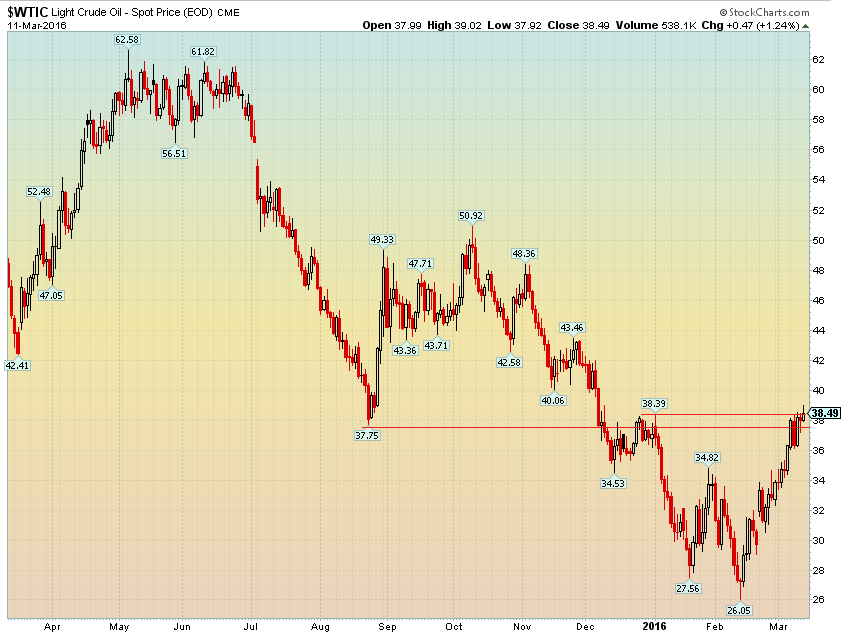
Kicking things off with Crude Oil, what a move we have seen from the low of $26, which was a level not seen since May 2003. Friday finished off the highs, but it was still good enough for the highest daily close since December 4 of last year. The $38-38.50 area appears to be very important for the near-term future of Crude. It has seen inflections at this level in the last several months.
Crude Oil Prices – 1 Year Chart
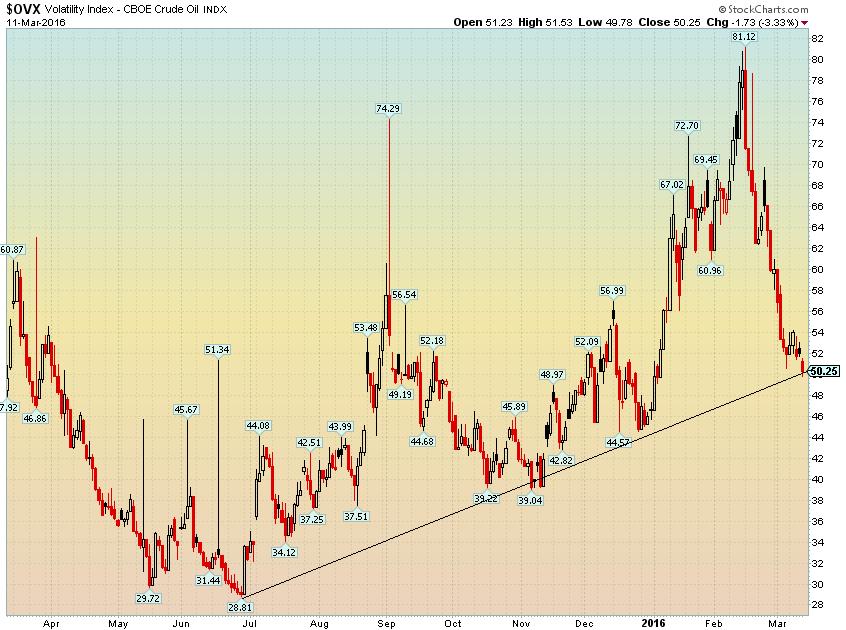
What is interesting is the dramatic decline in the Oil Volatility Index as measured by OVX (which measures the implied volatility on the USO oil ETF, not Crude Oil itself). OVX spiked to above 81 in February, which was the highest mark since early 2009 during the financial crisis and commodity bust. OVX has since fallen all the way back to 50, which implies about a 14.5% expected move over the course of the next month. The 50 level marks trendline support for OVX, so this would potentially be a bearish indicator for Crude Oil should OVX hold the support line.
Volatility Index – CBOE Crude Oil Chart (OVX)
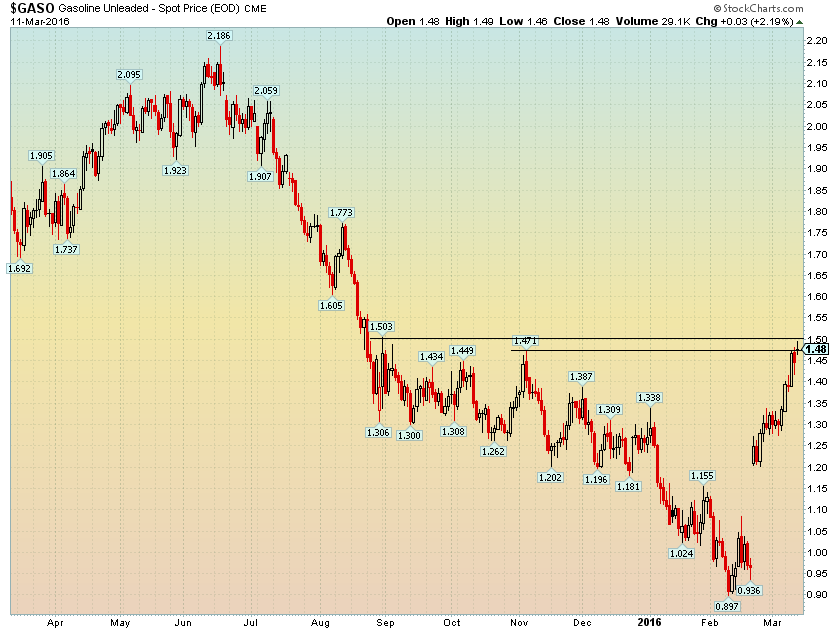
Taking a look at RBOB Gasoline. It has surged more than 50% in the last month, partly due to the annual contract roll from the March to April prompt month.
The April contract is the first month that is composed of the higher cost summer blend of gasoline – it usually carries a 25 cent premium to the winter blend. With very low prices relative to the last few years, 25 cents makes up a very big percent of price. Gasoline closed Friday near the highest levels since late last summer. A close above the $1.50 area would allow a rather clear path up to the $1.70-1.80 range. At the pump, tack on about 70 cents to the price of RBOB to get a general gauge of where retail prices are heading in the near-term. Once again, we see an energy commodity that was massively oversold just as energy market seasonality picked up.
Unleaded Gasoline – Spot Price Chart
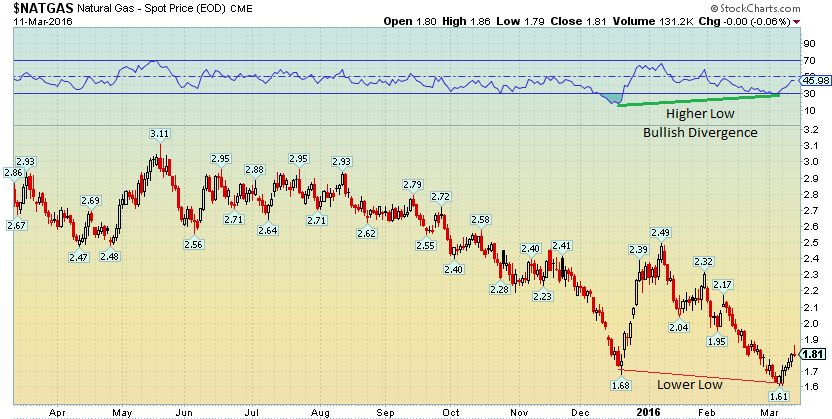
Finally, Natural Gas hit $1.61 earlier this month – a level not seen since 1995 for the power-related commodity. Since the year-to-date low, it rallied 15% to Friday’s high of $1.86 before settling slightly lower on the day, but up 8% for the week. Friday’s candlestick is a bearish gravestone doji, but we’ll wait to see how early next week trades for possible confirmation of this near-term bearish indicator. Taking a step back for a bit longer-term perspective, you’ll see on the below chart that the price of NG made a new low in March (versus the December low) while the momentum indicator above the price chart did not confirm the new low in price. This is a classic example of a positive momentum (bullish) divergence – where momentum and price diverge. This is seen as a positive indicator for the price of NG because it is thought that momentum will lead price. Clearly NG has a lot of work to do in order to build a sustained bottom, but the positive momentum divergence certainly gives hope to the bulls.
Natural Gas Prices Chart
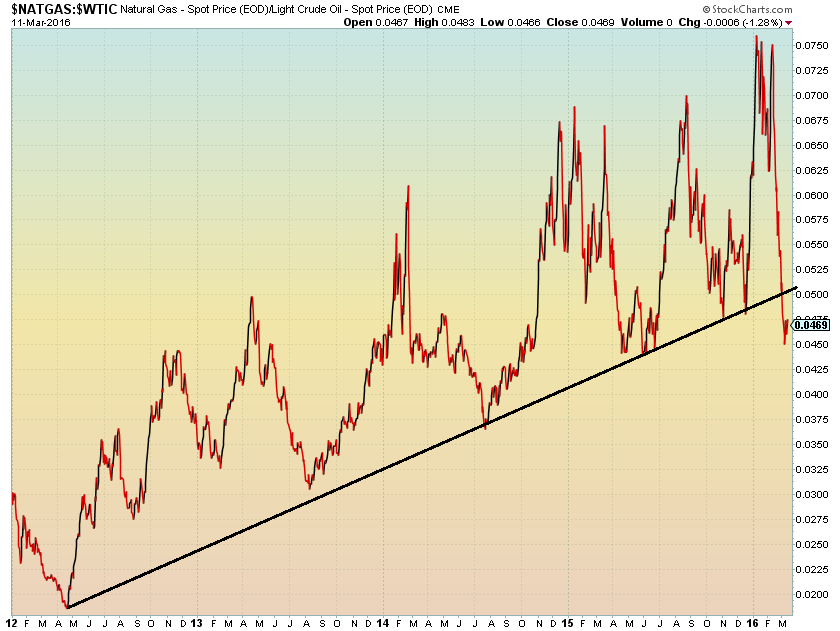
Another interesting look at the energy markets – comparing Natural Gas to Crude Oil. After 4 years of Natural Gas outperforming Crude Oil, it appears NG may be on the brink of a bearish breakdown on a relative basis to Crude Oil. Crude Oil’s recent rapid rise while NG has bounced around beneath $2 has led to this trendline potentially failing here.
Natural Gas Ratio Chart (to Crude Oil)
Thanks for reading!
Further reading from Mike: “Bear Market Drops Commodity Index To 43 Year Lows“
Twitter: @MikeZaccardi
No position in any of the mentioned securities at the time of publication. Any opinions expressed herein are solely those of the author, and do not in any way represent the views or opinions of any other person or entity.


: Showing Some Signs of Emerging Strength")
