 By Andrew Nyquist
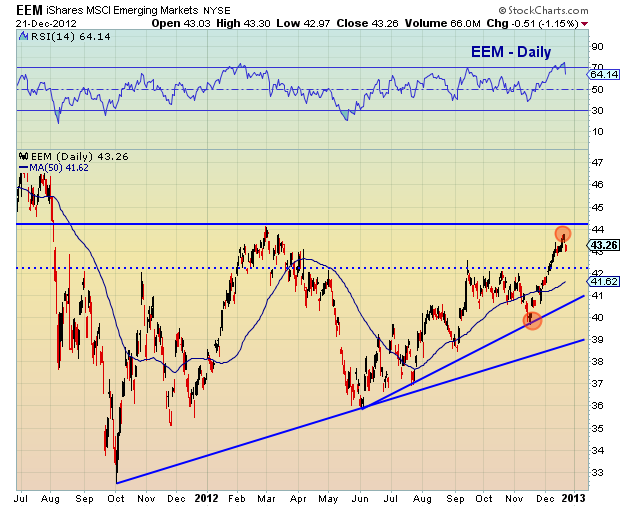
The price action in Emerging Markets (EEM) has many investors excited about the broader market prospects, for when high beta sectors (i.e. emerging market and small caps) start to act well, it’s a sign of risk on. Although this is true, one should note that the ETF has seen a pretty sizable short-term move higher and could use some healthy consolidation.
Looking at the chart below, you can see the recent move higher raced into resistance near the 2012 highs ($44ish) before taking a breather late last week. The action in and around this resistance band will be quite telling. If the near term consolidation/pull back continues, which I suspect it will, my focus will be on key support levels, including initial support at the 38.2 Fibonacci level ($42.30), followed by the 50 percent Fib level and 50 day moving average.
Trade safe, trade disciplined.
Twitter: @andrewnyquist and @seeitmarket Facebook: See It Market
No position in any of the securities mentioned at the time of publication.


