With all the opposing opinions on whether or not the market is topping or pausing for another leg up, it’s time to show the Family.
Once again from left to right
Top row: Granddad Russell 2000 ETF (IWM), Granny Retail ETF (XRT), Brother Tran Transportation Sector ETF (IYT).
Bottom row: Big Brother Biotechnology Sector (IBB), Prodigal Son Regional Banks ETF (KRE), Sister Semiconductors Sector ETF (SMH).
Economic Family of ETFs Chart
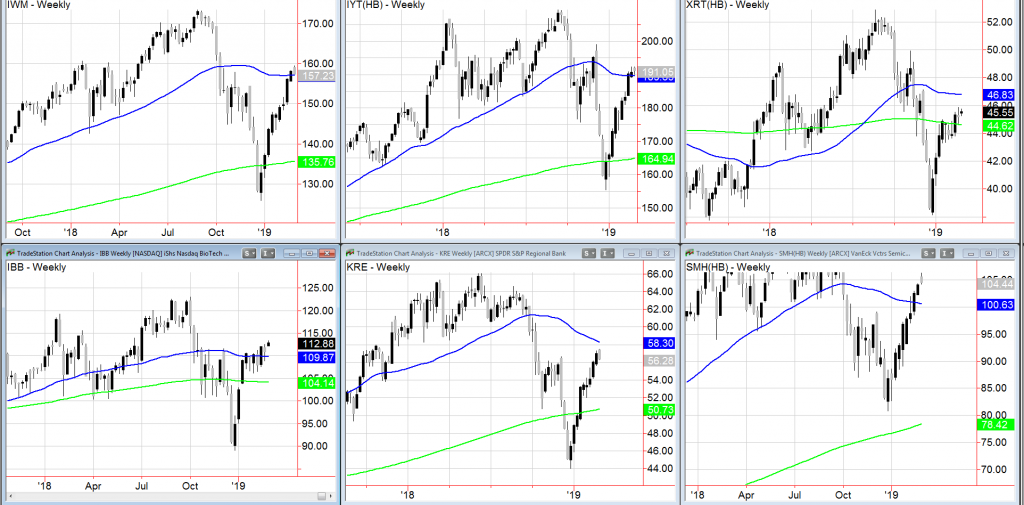
What is the Family telling us?
IWM broke the 50-WMA at 157 intraday and closed right on it. That makes it easy, right?
A weekly close below, sell signal. A close above, (especially above 158), most likely more upside.
IYT is above its 50-WMA at 189.65. Line in the sand. And if it can clear last week’s high, 195 next stop.
XRT is having an inside week so far. But, with decent earnings in Dillard’s and Macy’s, if it can hold above 44.60 and clear 46, could see 47 are next.
IBB cleared the 50-WMA last week for the third time. Third time a charm? 109.87 key area to hold.
KRE is holding over 56.00. 58.30 is the overhead 50-WMA. If the market stays firm, we should see that level tested. If not, under 56.00 trouble.
Finally, SMH has established 104 as the major support closest by. As the leader, if SMH gets going again, we could see 110. However, with the now confirmed topping pattern this week, we could also see a move down to 101 area.
All in all, these weekly snapshots give us an excellent way to step back and remove ourselves from the noise.
The Family might scream once in a while, but in the end, they always show us the way.
Russell 2000 (IWM) – Closed under the 200 DMA and the 50-WMA. Alone, that would not be concerning. But with IYT end of day weakness, we have to watch how both play out from here
Dow Jones Industrials (DIA) – 260.30 was the last swing high before the crash. Friday high 260.40. It’s holding there on a closing basis until that changes
Nasdaq (QQQ) – 172.10 the 200-DMA pivotal. Nasty reversal patterns in all indices confirmed today
KRE (Regional Banks) – 58.18 the 200 DMA overhead with 56 the best underlying support then 55.00
SMH (Semiconductors) – 104 first pivotal support. Then 102. Topping pattern here too
IYT (Transportation) – Broke the 200 DMA but not the 50-WMA. If does, writing for a much bigger correction on the wall
IBB (Biotechnology) – 109.83 the pivotal point.
XRT (Retail) – 44.62 pivotal support with 46.80 major resistance
The authors may have a position in the mentioned securities at the time of publication. Any opinions expressed herein are solely those of the author, and do not in any way represent the views or opinions of any other person or entity.


 Pressuring Lower Price Support")


 Pressuring Lower Price Support")