Sometimes it is just that simple.
The Economic Modern Family has had its share of rotation.
By rotation this year, we mean that while Semiconductors wowed, Regional Banks soured.
By rotation this year, we have looked to certain members of the Family to hold their lead and wait for the other members to catch up.
Or, conversely, we have held our breath as we have watched the leaders take a pause while the laggards need to hang in there.
2023 has been a bit of a cha cha cha in that way.
No doubt the consumer has participated.
First, the retail investor has gotten the rally right.
Secondly, the consumer has gone out this year and spent money.
That money has been mainly spent on services though that include restaurants and travel.
However, year over year credit card spending continues to decline with the low-income consumers showing the largest rate of decline.
We ask, is this sustainable?
Let’s see what Granny Retail (XRT) has to say.
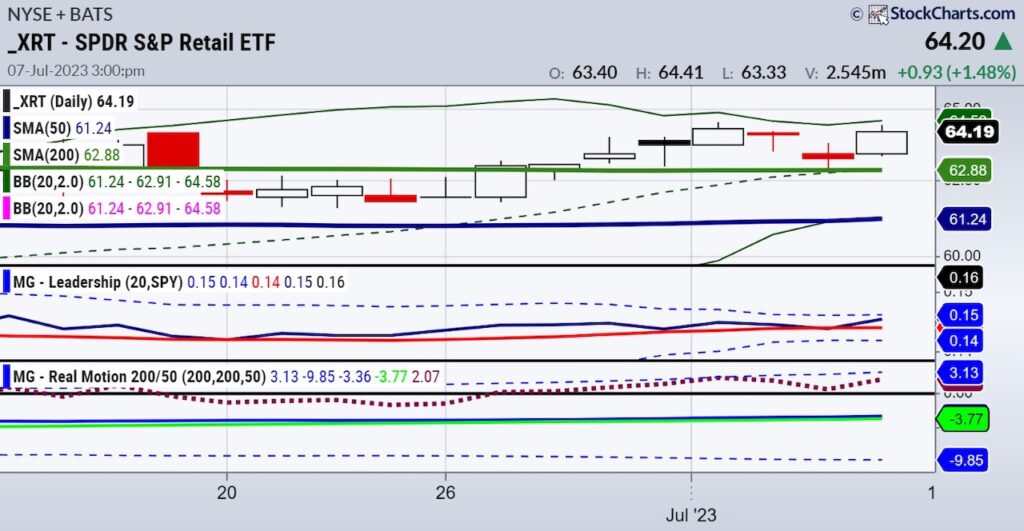
On the Daily chart, the Retail Sector ETF (XRT) is in a bit of a tight range between 63.00-64.50.
We love the leadership against the SPY benchmark.
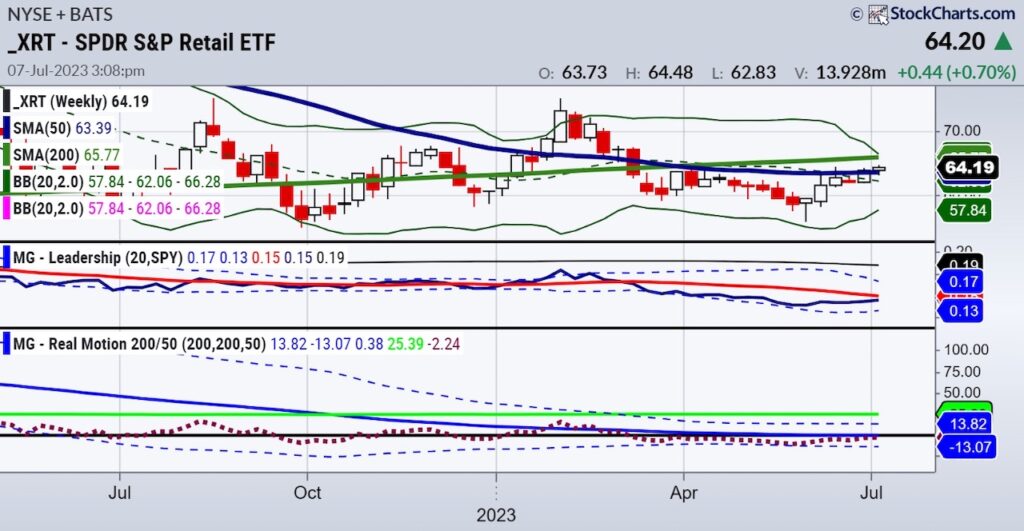
On the weekly chart, we got a second close over the 50-week moving average or a confirmed phase change to a recuperation.
SPY continues to show leadership on a weekly closing basis. Momentum is lagging considerably.
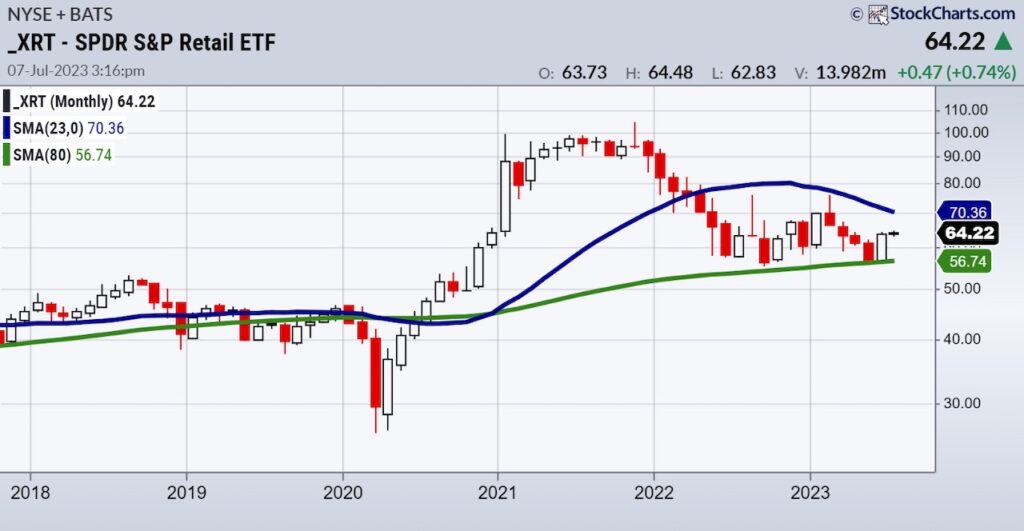
On a monthly chart, XRT has a far distance to go to clear the 23-month moving average.
To see sustained expansion, that blue line has to clear. Putting together all three timeframes, the Retail Sector (XRT) is key. XRT has to breakout over 64.50. Then, we need to see XRT clear the 200-WMA at 65.80 area.
Finally, on a monthly chart, we cannot get too excited unless it clears over 70.50. It’s a battle for sure-and one that will give you the best heads up on recession, stagflation or expansion.
At least we can say for now-Granny may need her cane to bow, but she yet to leave the mall.
Stock Market ETFs Trading Analysis & Summary:
S&P 500 (SPY) 443 now resistance 440 pivotal and 430 support
Russell 2000 (IWM) 185 pivotal
Dow (DIA) 34,000 back to pivotal resistance
Nasdaq (QQQ) 370 now resistance with 360 support
Regional banks (KRE) 40.00 -42.00 current range
Semiconductors (SMH) 150 back to pivotal number
Transportation (IYT) 250 pivotal and under 245 expect more selling
Biotechnology (IBB) 121-135 range
Retail (XRT) 63 support
Twitter: @marketminute
The author may have a position in mentioned securities at the time of publication. Any opinions expressed herein are solely those of the author and do not represent the views or opinions of any other person or entity.


