Negative Interest Rates, Central Banks and Recessions
It seems that there is not a single day without some comments or jawboning from a central bank when it comes to monetary policy on a global basis. Many thought that ZIRP (Zero Interest Rate Policy) was the absolute floor for interest rates. Now, central bankers have cooked up another way that they believe will help stimulate growth and meet their intended inflation targets by adopting a Negative Interest Rates Policy (NIRP). All the while, hoping to stimulate the stock market as well…
The European Central Bank (ECB) & the Bank of Japan (BOJ) both have adopted similar policies on a grand scale to fix their structural issues. The big question is, “Will Negative Interest Rates work?”.
Personally, I think these policies are absolutely ludicrous and damaging to the banking system. Essentially, Central Banks are taxing cash deposits and forcing banks to lend at even lower interest rates, which leaves them with very little profit. The next issue may lead to significant duration risk for financial institutions. Banks may be forced to make loans with longer maturities, which may be more profitable but may end up being more risky and can cause more pain further down the road. How can this stimulate the economy and gdp growth when bank profits are essentially floored. And why would they want to take on excess risk with clear uncertainties?
These policy moves are becoming less and less effective and adding to the uncertainty. In a typical capitalistic system, one would like to think that the global economy would eventually pick up steam without constant central bank support. This uncertainty is likely hitting the stock market in 2016.
As well, it strangely echoes the uncertainty created in 1937 (more on that below).
The Federal Reserve finally raised interest rates after 8 years of keeping rates at zero in order to stimulate growth, heal the U.S. job market and lift financial asset prices. The Federal Reserve continues to blame the global economic slowdown and the tightening of financial conditions as the reasons they can’t move any further with their current policy. In reality, overseas markets are slowing down, but so is the U.S. economy. With the recent release of U.S. GDP on January 29th, the U.S. economy grew at 0.7%. Now we understand why global stocks, bonds, currencies, and commodities are facing uncertainty (yep, all of them).
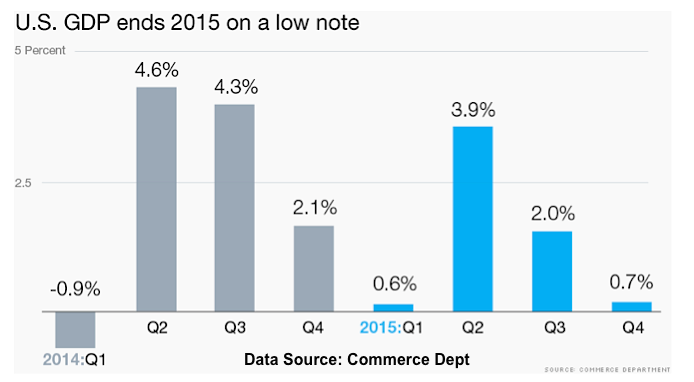
(Source: CNN)
GDP data is only one part of the equation and I think if the Fed doesn’t move slowly with their intended policy of raising interest rates, it could damage or ruin the 7 year recovery. This reason is why I believe financial markets have backed the Federal Reserve into a corner and I do not think we see any interest rate normalization in the next few years. Perhaps negative interest rates first… ugh.
Bank of America published a review of central banks policy since the crisis that laid out the extraordinary moves that have happened.
- Central banks now own over $22 trillion of financial assets, a figure that exceeds the annual GDP of US & Japan
- Central banks have cut interest rates more than 600 times since Lehman, a rate cut once every three 3 trading days
- Central bank financial repression created over $6 trillion of negatively-yielding global government bonds
- 45% of all government bonds in the world currently yield <1% (that’s $17.4 trillion of bond issues outstanding)
- US corporate high grade bond issuance as a % of GDP has doubled to almost 30% since the introduction of ZIRP
- US small cap 5-year rolling returns hit 30-year highs (28%) in recent quarters
- The US equity bull market is now in the 3rd longest ever
- 83% of global equity markets are currently supported by zero rate policies
(Sourced from Zero Hedge)
1937 Comparison
Before the 1936 tightening of monetary policy, the U.S. economy was recovering from the Great Depression from 1929 to 1932. After the U.S. expanded for 50 months from March of 1933 to May 1937, real GDP fell by 11% from May of 1937 to June 1938. Industrial production fell by 32%, which was unprecedented at the time (Source: World Bank). When comparing this to what occurred in 1936, one can see that the Federal Reserve was extremely accommodating in their effort to keep interest rates low. The issue arose when they then began tightening monetary policy in August of 1936, which eventually led to a massive stock market collapse from 1937 to 1938. The stock market is acting in a similar manner… 2016-2017 may not be a repeat, but perhaps a rhyme.
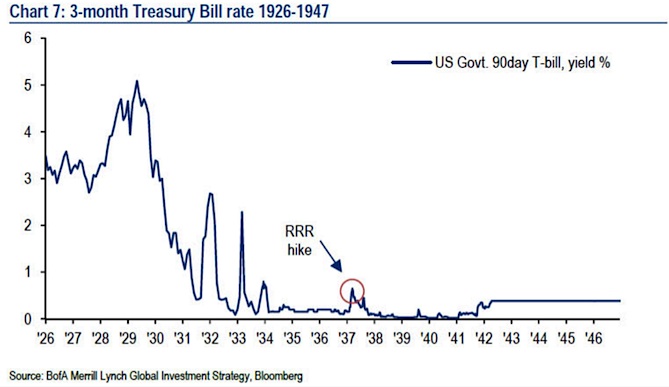
Chart Overview of Dow Jones Industrial Average During the Great Depression.

I am not suggesting that the Dow Jones Industrial Average will fall 50%, but portfolio managers are noticing similarities to 1937.
I do think the Federal Reserve will need to go back to zero interest rates policy or possibly launch negative interest rates. At some point either later this year or in 2017, I do think we will see another round of Quantitative Easing (QE) to stimulate growth. Global currency wars are only getting started and I think this will eventually lead to significant volatility shocks to the global financial markets.
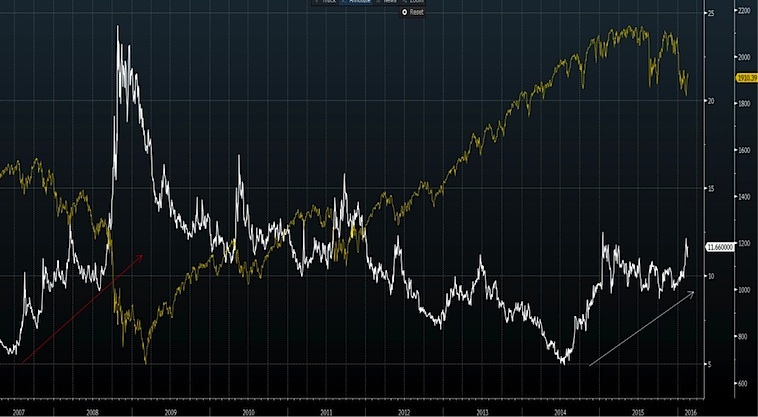
I’ll leave you with a chart of currency volatility (white line) vs. the stock market (S&P 500 index – yellow line). When the white line moves higher, currency volatility is increasing.
Thanks for reading!
The material provided is for informational and educational purposes only and should not be construed as investment advice. All opinions expressed by the author on this site are subject to change without notice and do not constitute legal, tax or investment advice.
Further reading from Korey Bauer: “Crude Oil: A Review Of 2015 and Outlook For 2016“
Twitter: @stockpickexpert
The author or his clients may have positions in mentioned securities at the time of publication. Any opinions expressed herein are solely those of the author, and do not in any way represent the views or opinions of any other person or entity.


