Crude Oil 2015 Review and 2016 Outlook – In Charts
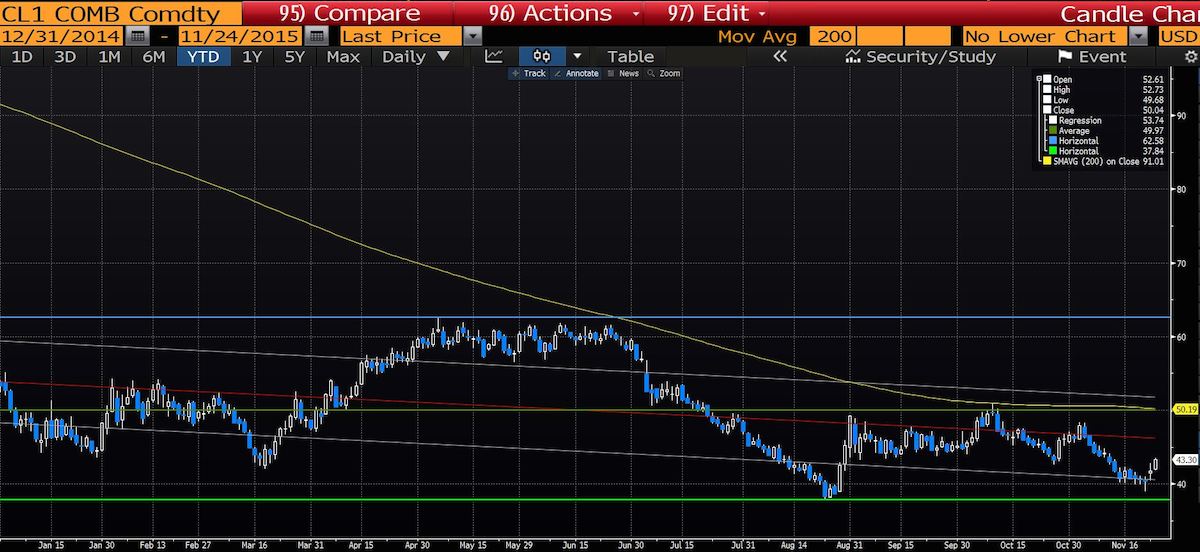
In 2015, crude oil has been down 19% and continues to fall further as the global glut remains intact. Crude traded as high as $62.58 on 5/6/15 and as low as $37.75 on 8/24/15.
Interestingly enough, the average price traded year to date is $49.97, while the 200 day moving average is sitting at $50.19.
In order to analyze charts, I utilize a regression. Prior to the bounce that occurred on November 23rd and 24th, crude traded in harmony with the low of the regression channel.
Crude Oil Price Chart – 2015
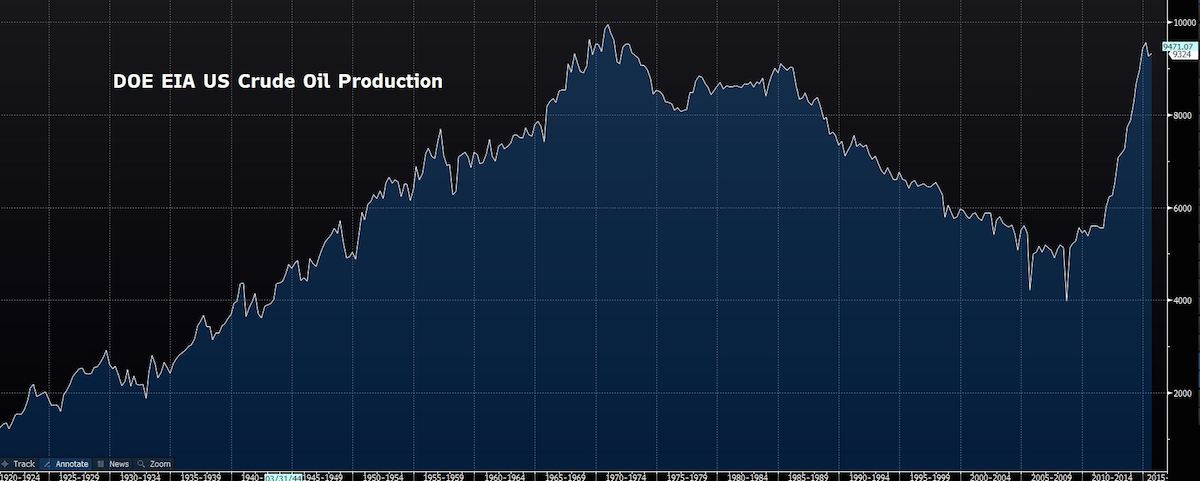
Oil Production:
When viewing this chart, one can see that production exploded over the last five years.
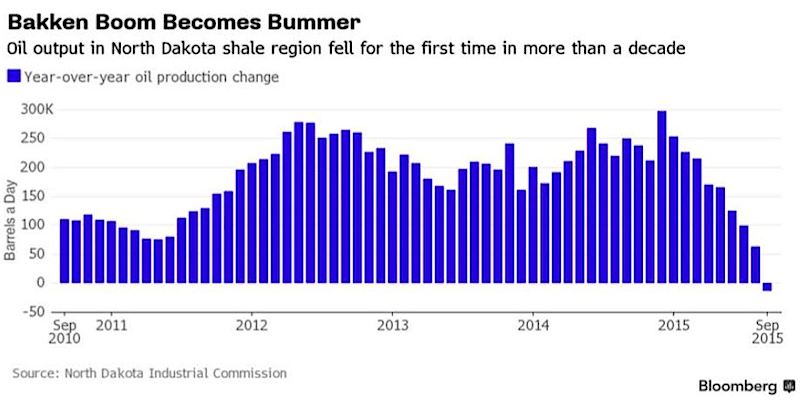
The oil output in the shale region of North Dakota is now producing less oil in September than it did in 2014.
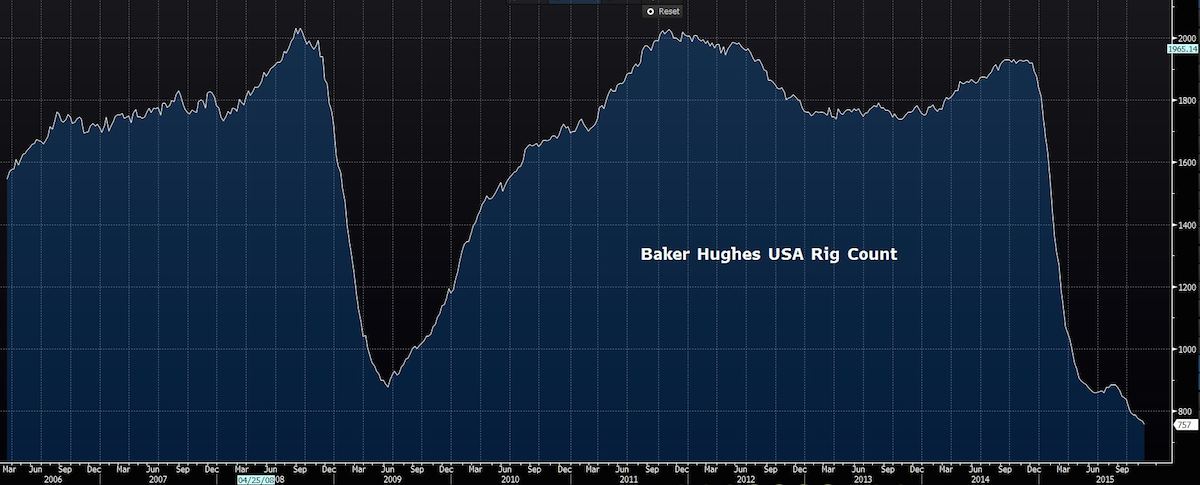
Rig Counts:
In this chart depicting the U.S. rig counts, one can see that there was a complete collapse over the last year.
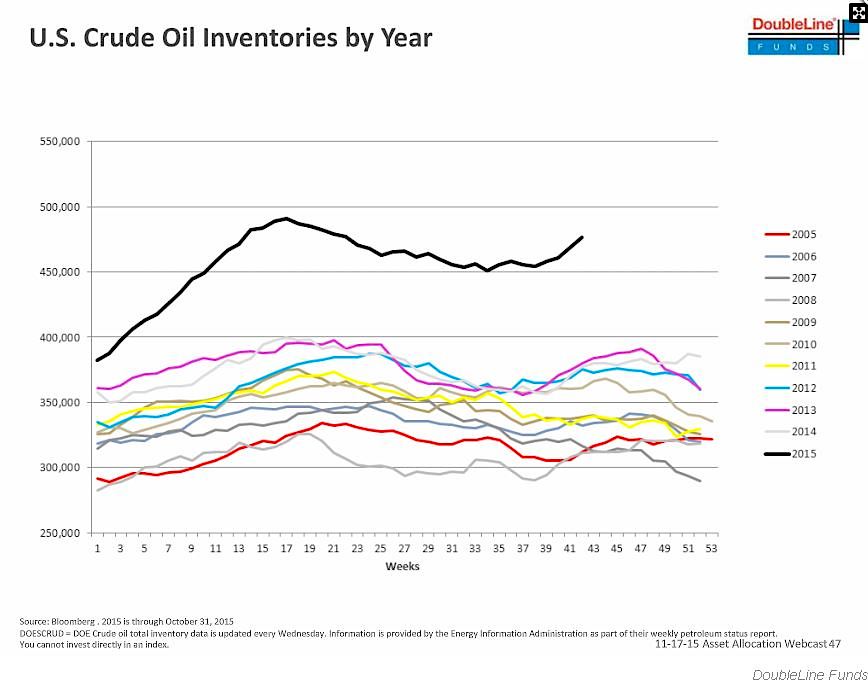
Inventories:
This U.S. Crude Oil Inventories by Year chart depicts what is known as a “glut”.
continue reading on the next page…


