Ahead of the ECB’s November policy decision later today, the air is rife with speculation over whether President Mario Draghi will unveil yet further accommodative measures (read: QE), particularly after the Bank of Japan’s surprise announcement they are Doubling Down (Again) on QQE last week (also see here for the critical point this places Japanese stocks at and here for how BoJ measures will impact US stocks). Any additional stimulus would follow a raft of already ambitious measures that were just rolled out, including the ECB’s underwhelming TLTRO program and month-old Covered Bond and ABS purchase programs.
Today’s meeting comes amidst a deepening deflationary drift in the Euro Area that has stabilized around 0.5% HICP over the last 6 months:
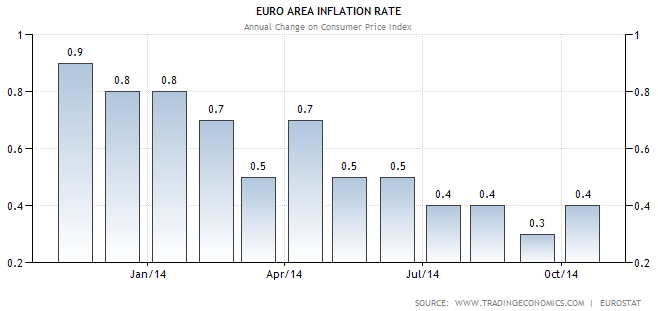
It is true this is far below the ECB’s stated target mandate of 2%; but it does show (to borrow a long-time favorite phrase of Draghi’s) “signs of stabilization…albeit still at low levels” – if only enough to mute broader adoption of a dovish urgency that would throw support behind QE.
Overall then, the outlook ahead of today’s meeting seems much the same the one offered before October’s meeting:
On balance, the ECB is likely to proceed at a measured pace at Thursday’s meeting, hesitant to “go nuclear” with the introduction of full-blown LSAP before the incipient TLTRO and ABS programs have been given an opportunity to register their (in)efficacy as policy transmission mechanisms. Draghi is unlikely to effectively concede the failure or obsolescence of one program that has just begun and another that hasn’t even been introduced by obliquely referring to – much less rolling out – a far more ambitious program that will have strong detractors – viz., Bundesbank Chief Jens Weidmann among others – and is guaranteed to invite major legal challenges citing a clear violation of Article 123 of the Treaty of Lisbon both in Brussels and before the German Constitutional Court in Karlsruhe.
As a result, unless Draghi is overtly pessimistic (which strains credibility given the context above), calculus for Thursday’s meeting seems to skew bullish for EURUSD.
Silver-tongued persuasion and seemingly autocratic (that, incidentally, has the Governing Council at the brink of open insurrection) jawboning aside, the ECB seems poised to disappoint dovish expectations of Euro Area QE.
Turning to the EUR/USD, the Euro looks poised to take up a countertrend rally across multiple timeframes, just as it did after October’s ECB decision.
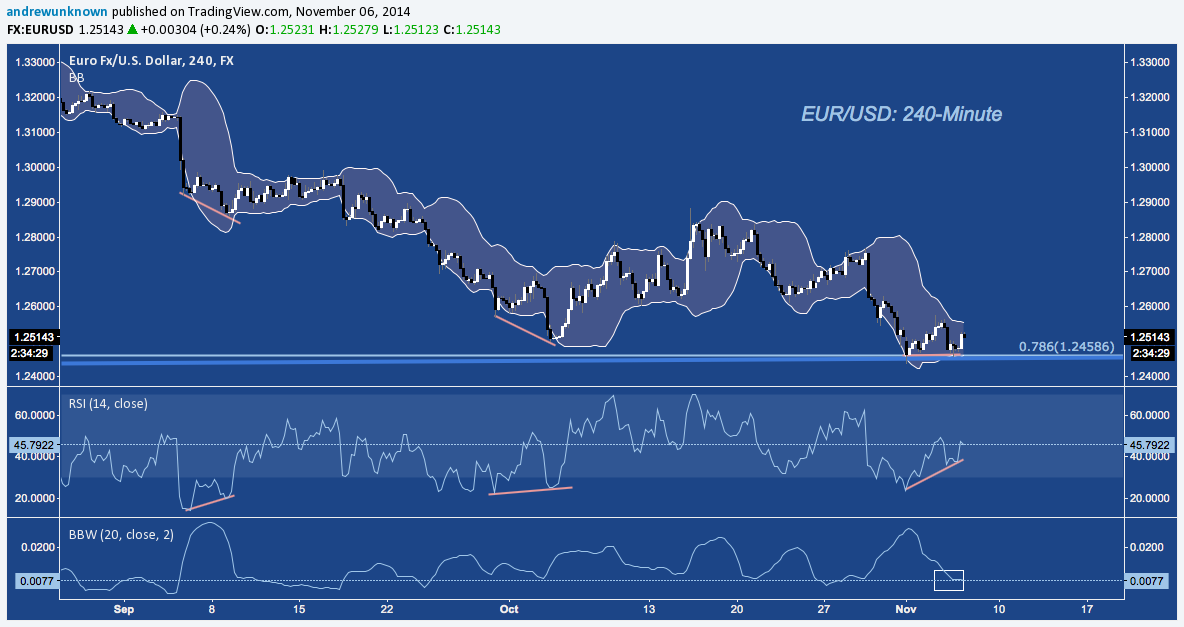
On the 4-Hour chart below, note the positive momentum divergence setting up over the last week into key trend line support (more on this in a moment). Looking at its Bollinger Bands, EURUSD is clamped into a very compressed range, pointing to directional volatility just ahead.
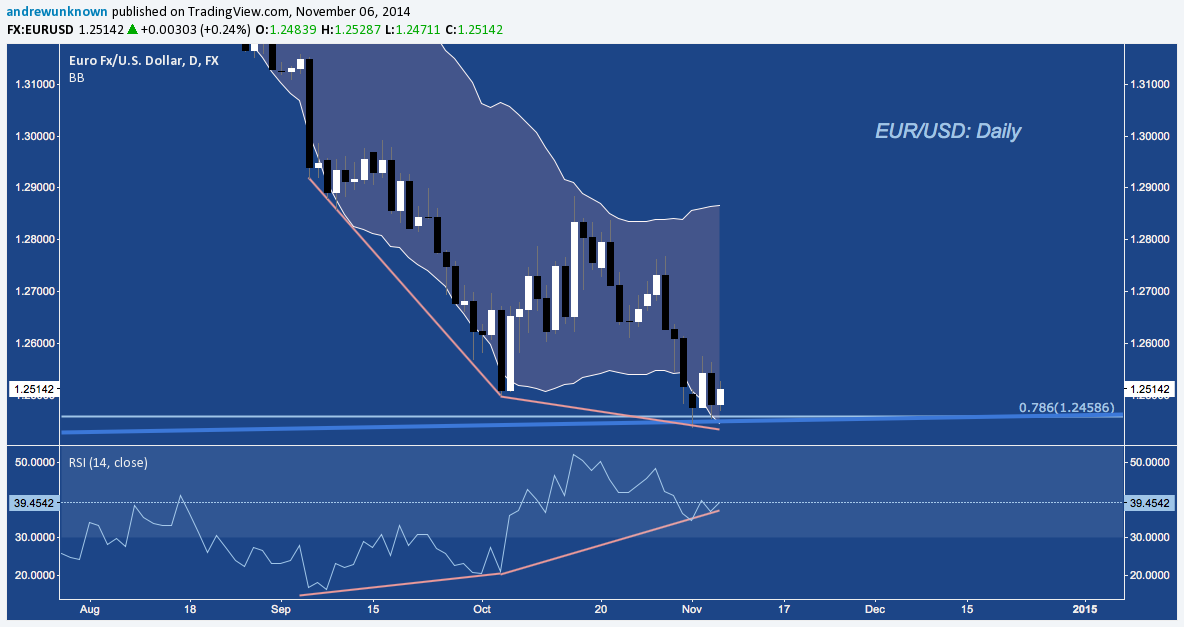
The Daily chart continues this theme, showing a building positive momentum divergence against two points of articulation, coinciding with the ECB’s September 4th and October 2nd meetings.
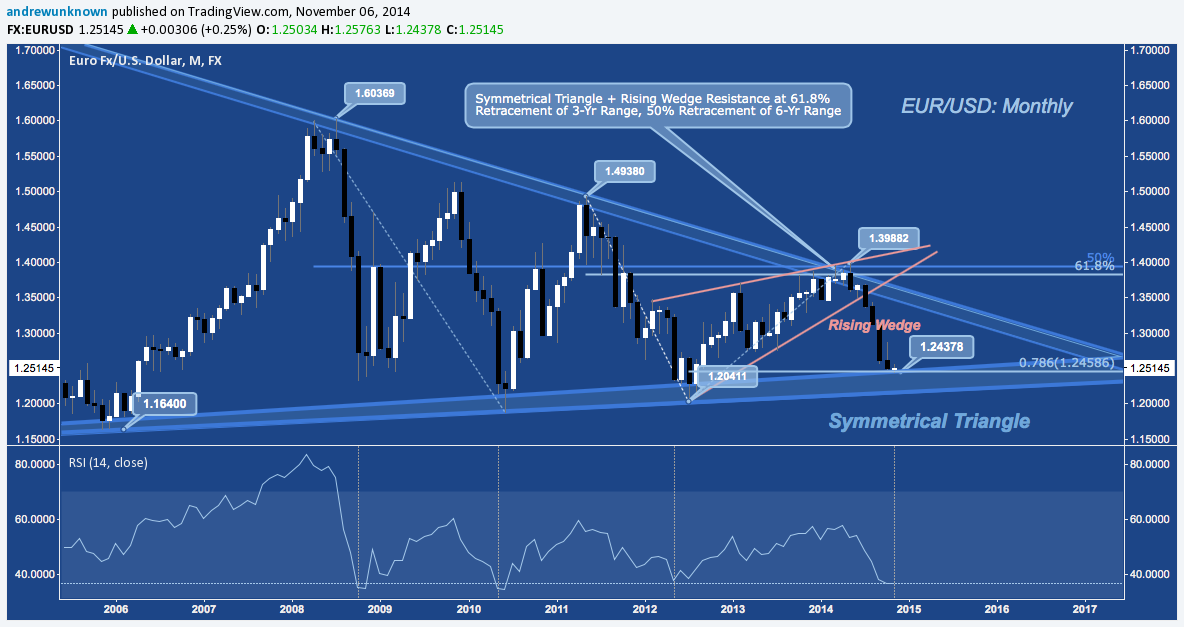
On EUR/USD’s monthly chart, we see these divergences are set up at the 78.6% fibonacci retracement of the 2012-2014 rally, and at multi-year Symmetrical Triangle trend line support. Likewise, while RSI can continue to plumb lower into oversold territory, this level is consistent with where longer-term bottoms have been hammered out in 2008-2009, 2010, and 2012:
The latest Commitments of Traders data on the CME’s Euro FX Futures (E6) product continues to corroborate the idea of a market setting up a (at least) short-term rally.
Note the contract’s record open interest (OI) blowoff: a feature also observed at the 2008-2009, 2010, and 2012 bottoms. A closer look at OI shows Commercial Speculators (red) just off 2012’s record long positioning. Inversely, Large Speculators (green) almost record short.
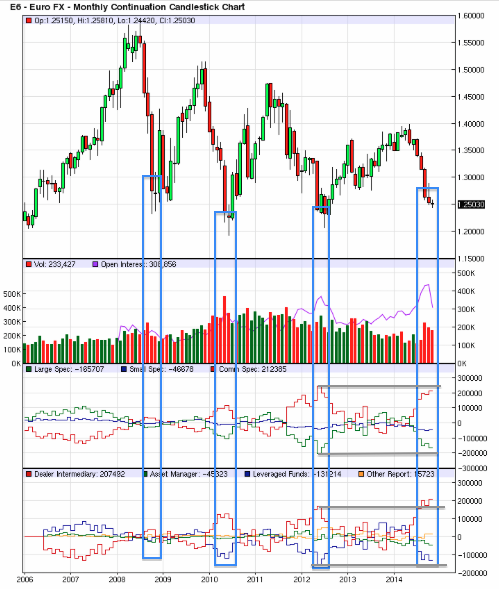
The disaggregated data in the lower panel carries these trends even further: Dealer Intermediaries (whose M.O. is a neutral/hedge book) are now record long as Asset Managers (green) and Leveraged Funds engaged mostly in outright directional speculation are combine into a record short. Taken together, this reflects a market that has never been positioned more deeply short on the Euro than it is right now.
In its own way, CoT is every bit the momentum indicator RSI is. As noted above on RSI, CoT data too can always continue to become more polarized. However, the weight of the technical evidence suggests any further deterioration in the Euro is likely to be minimal – at least until market positioning resets.
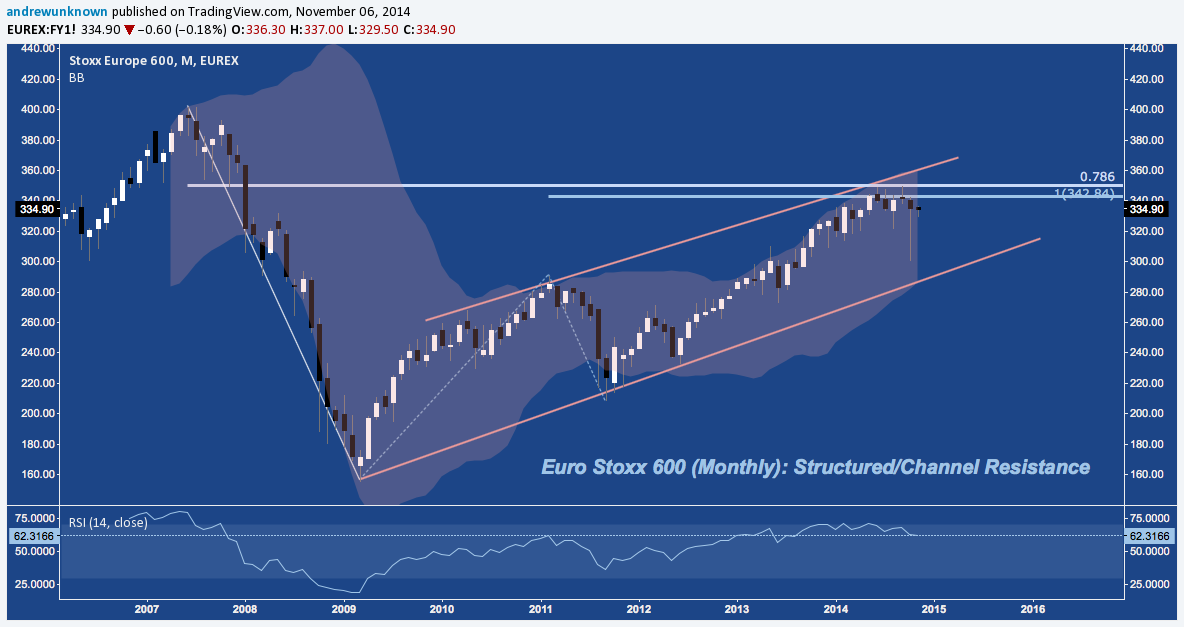
In contrast, European stocks look similarly polarized; but at multi-year or all-time highs.
The Euro Stoxx 600 rang into a major confluence of rising channel and fibonacci cluster resistance near 350 over the Summer. October’s abortive correction reach down toward channel support before reversing back into the index’s 6-month range to continue the technical stalemate.
The German DAX remains -8% off the all-time highs it established in July, with its impressive move off the mid-October lows on-pause at the index’s upper Bollinger Band and 50-Day Simple Moving Average (SMA) near 9300:
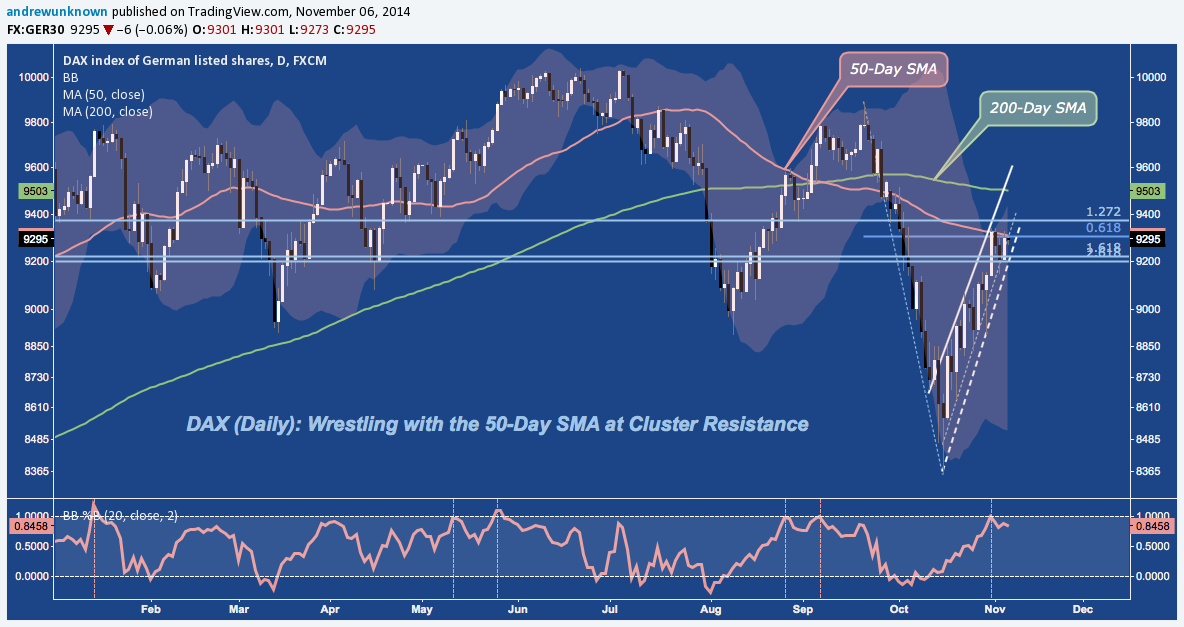
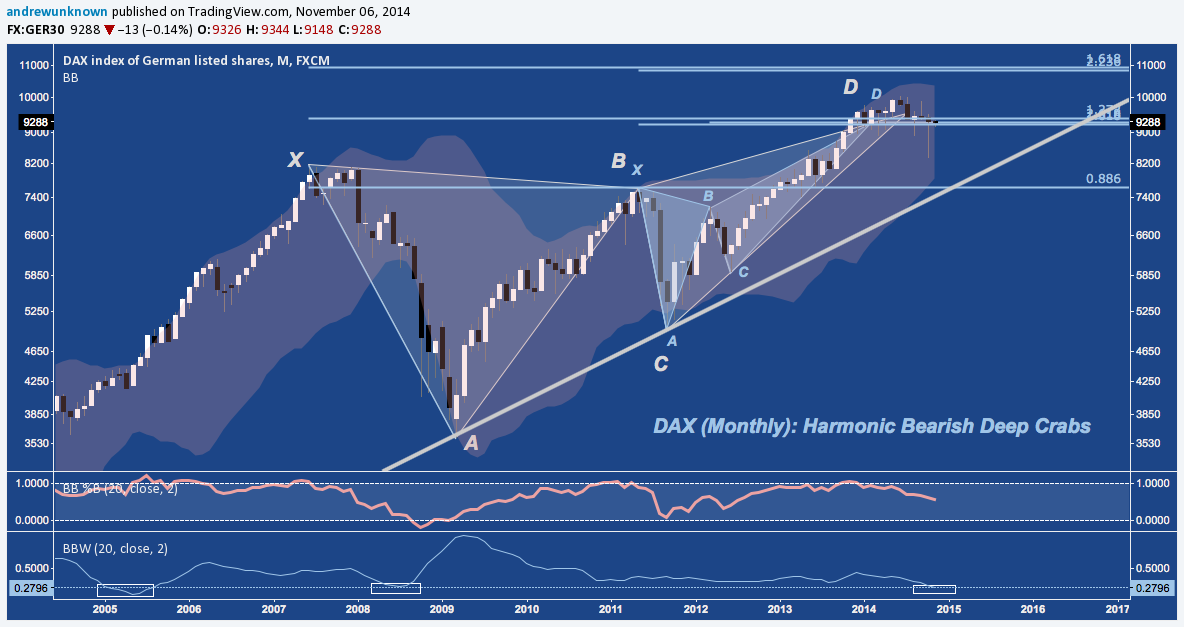
Like the Euro Stoxx 600, DAX’s rally has returned to it’s own year-long technical impasse. The 9300-9800 level it continues to struggle with is the site of major fibonacci resistance that’s typified by the two Bearish Deep Crab harmonic patterns with Potential Reversal Zones (PRZ) there.
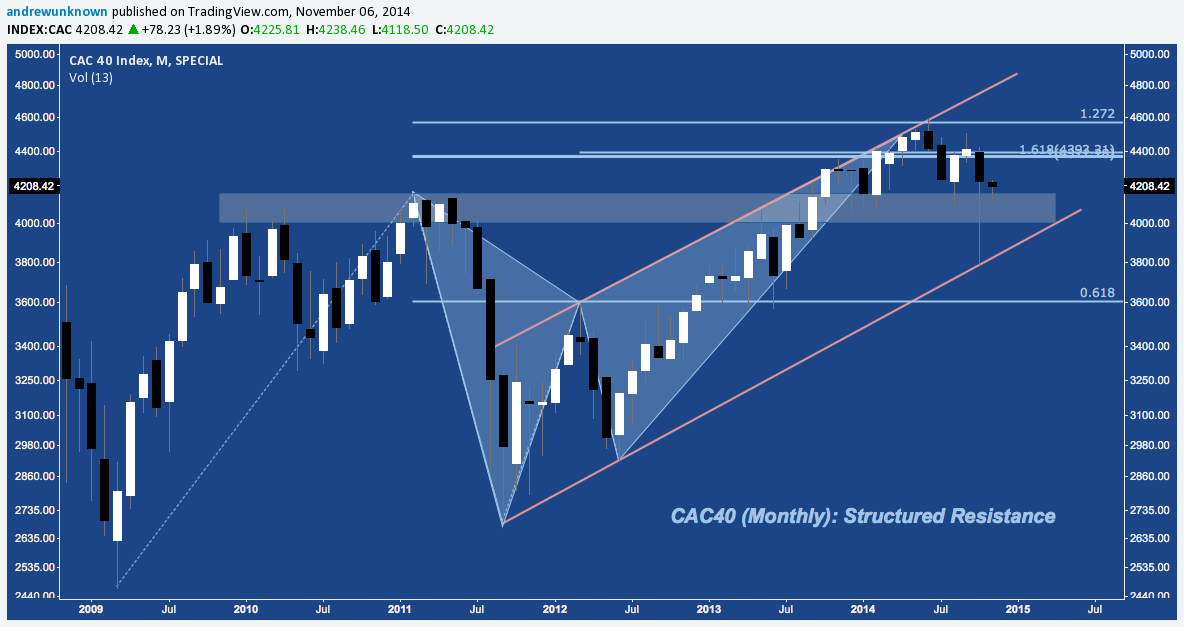
France’s CAC 40 index is also at post-crisis structured resistance, riding support below at 2011’s high, but push back from multiple fibonacci levels and the rising channel trend line just overhead.
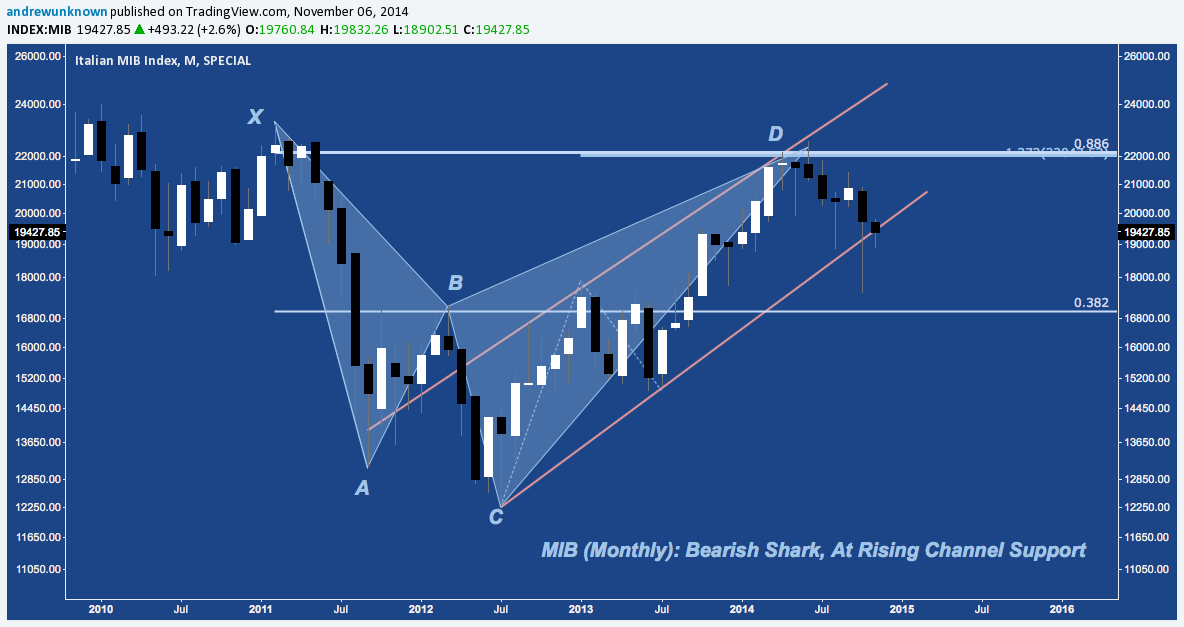
Italy’s benchmark MIB index was more soundly rejected at the Summer’s highs, traversing back across it’s 2-year Rising Channel where it is testing support yet again in the larger context of a Bearish Shark harmonic pattern that calls for a further decline of -10-15%, at minimum.
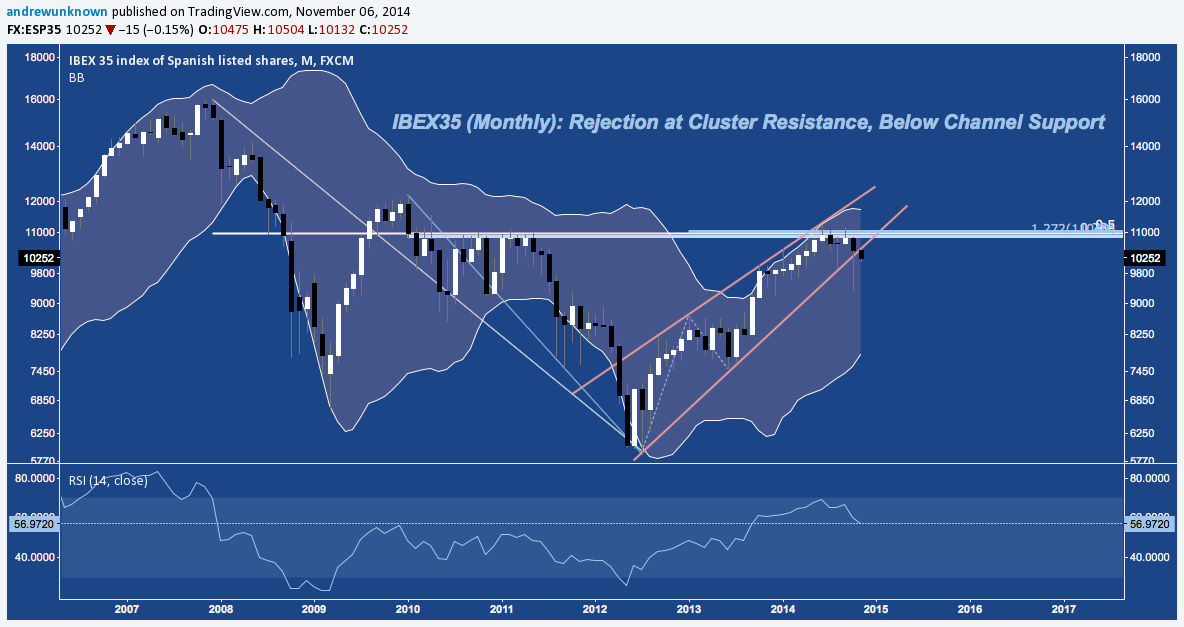
Spain’s IBEX35 index has set up similarly to Italy’s MIB, but has deteriorated further since it’s Summer peak. After another sustained attempt to retake 11000 (see 2010 and 2011), IBEX yield to an impenetrable ceiling of fibonacci cluster resistance there in October, rolling hard before rallying with the rest of the world to just reclaim it’s 2.5-year Rising Channel. November, however, has picked up where early October left off, opening at and since pushing lower from channel support.
Twitter: @andrewunknown
Kassen holds no exposure to securities/instruments mentioned at the time of publication. Commentary provided above is for educational purposes only and in no way constitutes trading or investment advice.

: Showing Some Signs of Emerging Strength")

