 By Andrew Nyquist
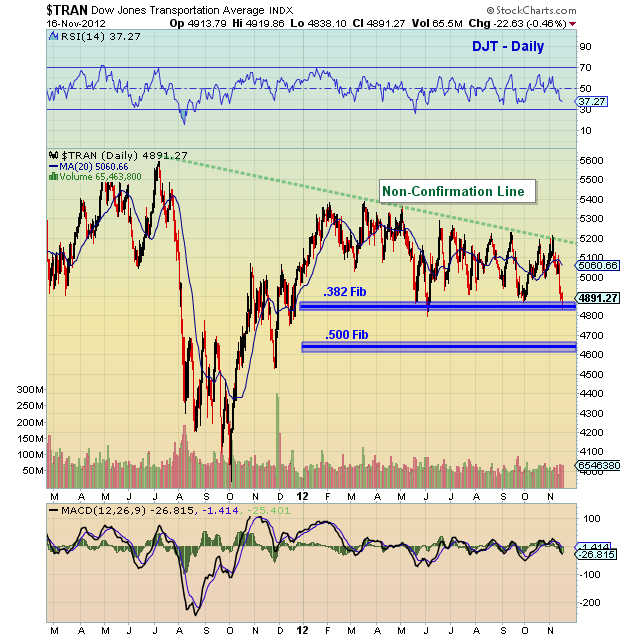
The Dow Jones Transportation Average is back on the 38.2 Fibonacci retracement magnet. It’s actually a bit surreal because my previous blog on the Transports came on September 29 when the index was similarly chillin on the fib.
The Transports have seemingly walked the tightrope all year long, showing weakness but also a “bend but don’t break” price action. This has been a solid “tell” for the slowing, recessionary-like economy. Inject the “fiscal cliff” talks into the situation and you have a volatile sector.
So will this non-confirmation lead to a further break-down? Watch the 38.2 Fibonacci level.
More charts found here.
Dow Jones Transportation Average price chart as of November 16, 2012. Dow Jones Transports chart with Fibonacci retracements and technical support levels. Dow Jones Transports technical analysis.
———————————————————
Twitter: @andrewnyquist and @seeitmarket Facebook: See It Market
No position in any of the securities mentioned at the time of publication.
Any opinions expressed herein are solely those of the author, and do not in any way represent the views or opinions of his employer or any other person or entity.


