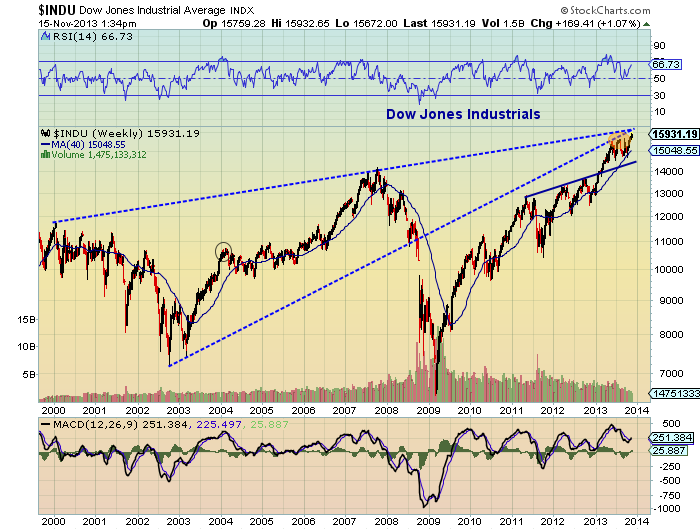
 Just a quick chartology post to get you thinking about both sides of the trade, bull and bear, and the many different time dimensions investors deal with… and how many unknowingly twist them to fit their bias. In the Dow Jones long-term chart below, it is clear that time and price are starting to align. Perhaps one can glean a Dow Jones long term outlook from the chart. BUT more than likely this would be accompanied by many other supporting factors and an understanding that this chart offers a wide-angle perspective (and margin for error).
Another more significant problem involves bias: yep, our own bias. Call it noise, call it the devil on our shoulder talking to us while we contemplate market moves, but it’s always something we battle as active investors. Perhaps you are bearish and you applaud the chart below (whether short or long-term), or perhaps you are bullish and you view the post/author as immediately biased because of the resistance lines. For these reasons, some may elect to not even read the post, depending upon which market narrative they are aligning with.
But, let’s break down the chart below… Perhaps the chart is saying something like this (grain of salt):
1. Price has gotten volatile near the backtest of the ’08 breakdown and rising tops of the 2000’s.
2. This point of intersection (squint and we’ll call it 16,000 to 17,000) will likely produce a significant correction… which is bearish.
3. Or the rising consolidation will contain the correction and lead to a break out above this level. The Dow Jones long term outlook is bullish.
4. A breakout is coming and a move above this level would be uber-bullish.
All these seem plausible, yet different. So just what the heck is the takeaway? Well, we all have opinions and narratives (h/t Andrew Kassen). It’s virtually impossible to actively trade a long-term chart. No doubt, it’s good to be aware as a nugget of macro perspective. No issues there. I use them at times, and even post them for a wide-angle risk perspective – good to keep an open mind. But, as active investors it’s best to trade what’s in front of you, using appropriate time frames for disciplined trading/investing.
Dow Jones Long-Term Chart
Twitter: @andrewnyquist
No position in any of the mentioned securities at the time of publication. Any opinions expressed herein are solely those of the author, and do not in any way represent the views or opinions of any other person or entity.
: Worrisome to Broader Market?")

: Important Breakout Retest")
