The 4 month stock market rally to start 2019 brought the Dow Jones Industrial Average within 1 percent of its all-time highs made in 2018.
This strong move higher has bulls excited about a new bullish wave higher that will lead to new all-time highs.
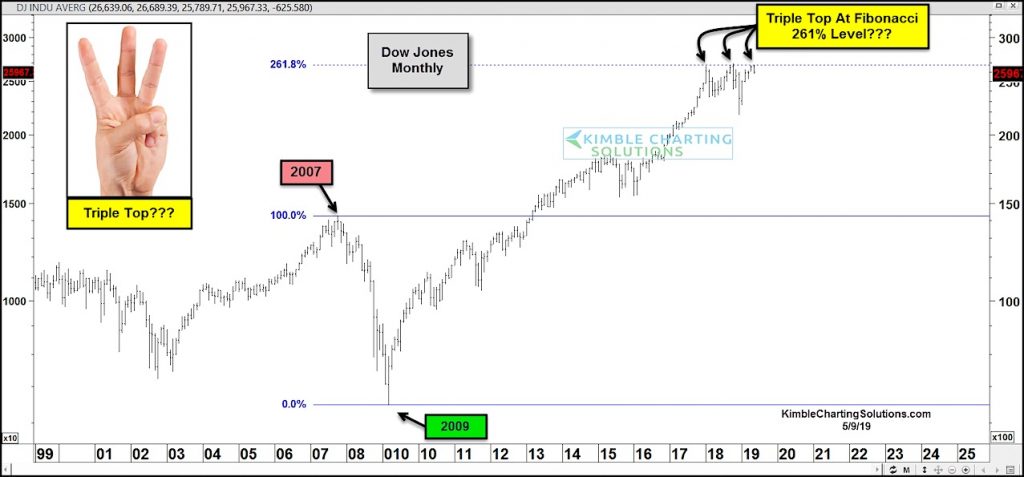
But that cannot occur until the Dow Industrials decisively break out to new highs.
And if bears have their way, this test of resistance will form the third and final top within a bearish triple top formation. See chart below.
At a minimum, this price area looks to be strong resistance. This triple top testing area also marks the 261.8 Fibonacci price extension.
A pullback or correction from this level would not be uncommon. Bulls want a breakout, bears want a triple top. Let’s see how it plays out! Stay tuned!
Dow Jones Industrial Average – Triple Top?
Note that KimbleCharting is offering a 2 week Free trial to See It Market readers. Just send me an email to services@kimblechartingsolutions.com for details to get set up.
Twitter: @KimbleCharting
Any opinions expressed herein are solely those of the author, and do not in any way represent the views or opinions of any other person or entity.


: Showing Some Signs of Emerging Strength")
