Investors have endured several scary headlines and lots of political noise / news.
But the stock market has remained resilient. This is why most active investors should focus on price and discipline (your enter/exit strategy).
In today’s exercise, we will look at a short-term view of the Dow Jones Industrial Average and one way to read the current price action.
There’s more color below, but the short-term trend line for the Dow Jones Industrial Average was lost recently. This is simply a caution signal and necessary price supports need to be identified (see my tweet from Tuesday morning below). At the same time, we have to understand that it is not uncommon for a trend line to be back-tested (even while setting new highs) – and this may be the area to further de-risk / sell into.
Note that the following MarketSmith charts are built with Investors Business Daily’s product suite.
I am an Investors Business Daily (IBD) partner and promote the use of their products. The entire platform offers a good mix of technical and fundamental data and education.
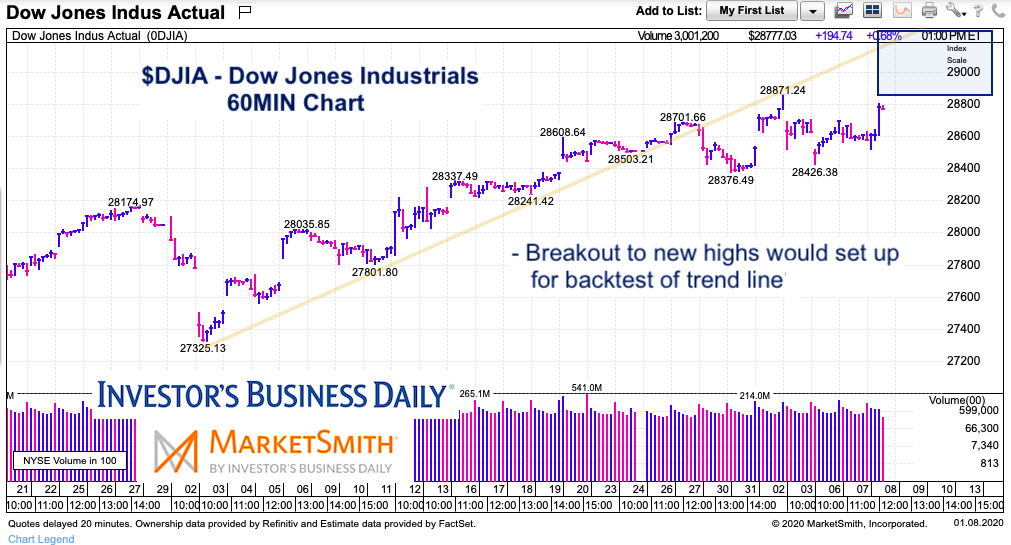
Here’s my tweet from Tuesday morning, along with a 60 minute bar chart:
$DJIA Dow Industrials holding just under all-time highs. #IBDpartner
— Andy Nyquist (@andrewnyquist) January 7, 2020
Bulls want 28200/400 support area to hold for another run higher. @IBDinvestors —> https://t.co/CCrRleXHh5 pic.twitter.com/aHz2iULpnj
Now let’s look at an updated Dow Industrials chart:
You can see that price is moving higher and testing its all time highs. A move over those highs would target a high over 29000 and potentially as high as 30000. Several trading cycles are pointing to mid-January as an interesting time.
Again, this is a near-term view. Zoom out for longer term investing timeframes.
Twitter: @andrewnyquist
The author may have a position in mentioned securities at the time of publication. Any opinions expressed herein are solely those of the author, and do not in any way represent the views or opinions of any other person or entity.


