In recent months we posted charts at See It Market showing why we think U.S. stock indices are trying to reach a new high.
The forecasts are working correctly, following the scenarios we described at See It Market on January 8 for the Russell 2000 ETF (NYSEARCA: IWM) and also on January 10 for the Dow Jones Industrial Average (INDEXDJX: .DJI).
The forecast we showed in April for the NYSE Composite Index (INDEXNYSEGIS: NYA) is working beautifully too.
In today’s post we show an update for the Dow Jones Industrial Average, which tested an important support area earlier this week. We expect it to climb to a new high later this year. We’ll also provide an update for the NYSE Composite during the upcoming weekend.
We believe a market top isn’t far away, but the Dow and other indices probably need to do more upward work first.
On the chart below, note how we don’t yet see negative divergence with the Adaptive CCI momentum indicator on the Dow Industrials chart below. In fact, the current area is a good candidate for a modest bounce from nearby support based solely on the momentum indicator’s test of its zero-line.
Dow Jones Industrial Average – Elliott Wave
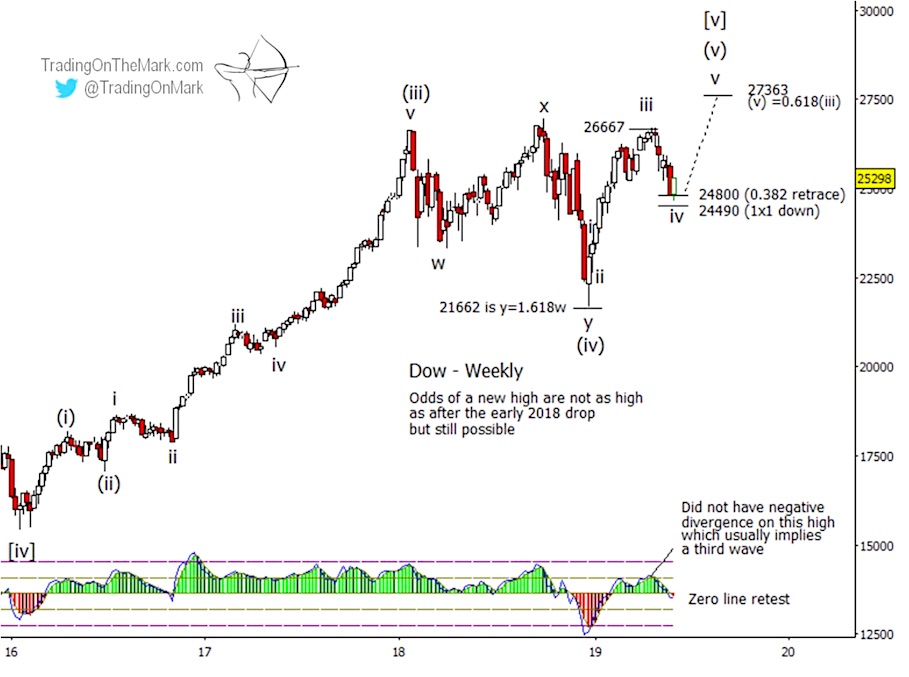
Two different Fibonacci measurement techniques combine to produce a Dow support zone in the area of 24800 to 24490. The higher of those levels was tested this week, and the test might be good enough to serve as a platform for a bounce that could persist through the summer.
Note how price action from early 2018 looked corrective into the late 2018 low with a nearly perfect Fibonacci ratio between sub-waves ‘w’ and ‘y’ of (iv).
Important resistance that might be tested later this year sits at the 0.618 Fibonacci price extension at 27363. That would allow for a nice higher high in the Dow, even if other indices put in an Elliott wave truncation. We’ll describe the truncation idea more in the next post.
This summer we’re offering really great chart subscriptions at deep savings to traders who get our free newsletter. Let us know if you’d like us to send you a copy.
In addition to the charts we share publicly, Trading On The Mark provides daily forecast updates for the S&P 500, treasuries, gold, the Euro, the Dollar, and crude oil. We also track the S&P 500 and other markets on an intraday basis. We invite you to see what’s available at our website.
Twitter: @TradingOnMark
The authors may have a position in the mentioned securities at the time of publication. Any opinions expressed herein are solely those of the author, and do not in any way represent the views or opinions of any other person or entity.


")

")

