One investing indicator/tool that gets overlooked is the bullish base.
And as the old say goes, “the bigger the base, the higher in space.” Or in other words, the bigger the base, the bigger the breakout.
That said, a sideways or (my preferred) cup-like base isn’t an automatic buy signal in and of itself. While you can deploy a strategy that buys within the base building phase (with a stop), it is actually the breakout over the top of the base that triggers the buy signal.
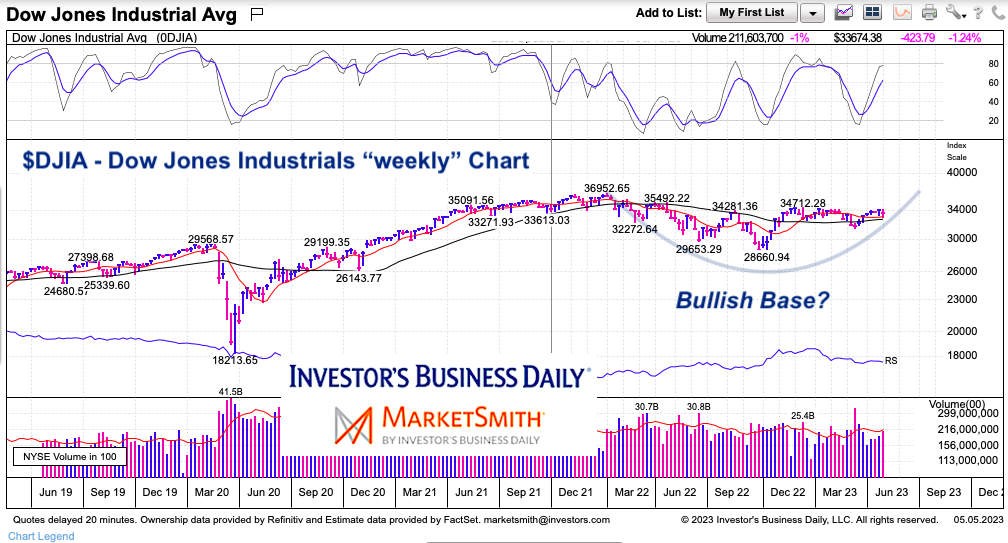
Today’s chart is simple. It’s a long-term “weekly” chart of the Dow Jones Industrial Average. It highlights a potential basing pattern that has developed over the past year. Just something to watch and be aware of.
Note that the following MarketSmith charts are built with Investors Business Daily’s product suite.
I am an Investors Business Daily (IBD) partner and promote the use of their products. The entire platform offers a good mix of tools, education, and technical and fundamental data.
$DJIA Dow Jones Industrial Average “weekly” Chart
A cup-like base appears to be forming. To complete this “cup”, I would prefer that the index remains above 30,000. A move below 30,000 would indicate that the index is in more of a longer-term sideways pattern and at risk of more significant short-term losses.
But if it can remain above 30000 it would keep the bullish base “cup” in play. And a breakout to new all-time highs would produce an initial target of 42076 (1.618 Fib).
Twitter: @andrewnyquist
The author may have a position in mentioned securities at the time of publication. Any opinions expressed herein are solely those of the author, and do not in any way represent the views or opinions of any other person or entity.

: Showing Some Signs of Emerging Strength")
