Investors around the world have a lot on their minds: Global trade wars (U.S. vs China and EU vs Britain), negative interest rates, and a murky global economic outlook to name a few.
Currently, the United States economy and financial markets are the strongest. You can see this via the U.S. stock market indexes or the US Dollar strength.
At times like these, I like to follow the Dow Jones Industrial Average INDEXDJX: .DJI
Why? Because it is the most visible U.S. stock market index outside the United States (internationally). So today, we analyze the chart of the Dow Industrials to tell a tale of what’s going on in the world. And why international investors are attracted to the US stock market index.
Note that the following MarketSmith charts are built with Investors Business Daily’s product suite.
I am an Investors Business Daily (IBD) partner and promote the use of their products. The entire platform offers a good mix of technical and fundamental data and education.
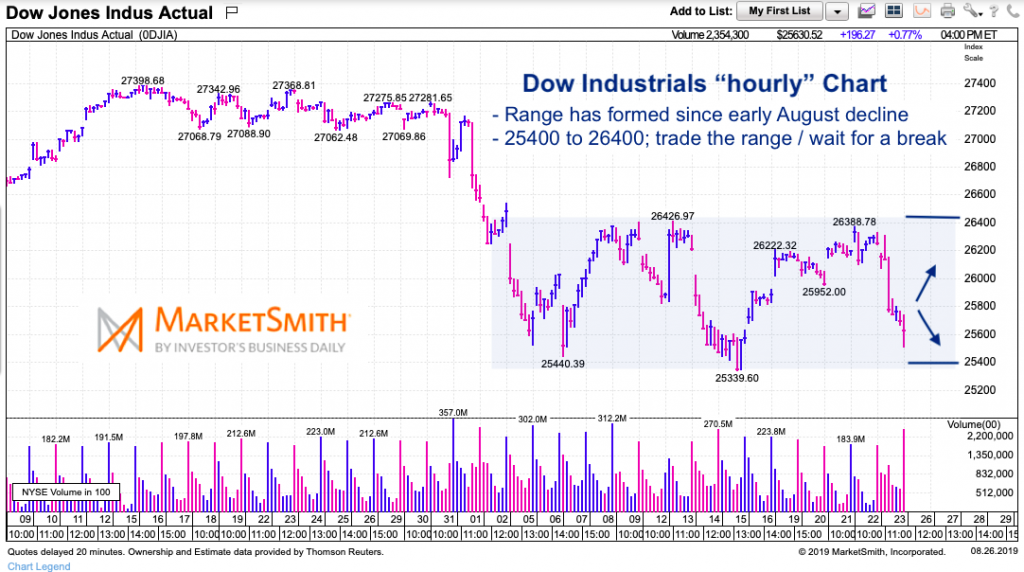
Dow Jones Industrial Average “hourly” Chart
This is an “hourly” chart that goes back far enough to see the decline into August and the subsequent rangebound price action.
Since the early August low, the Dow Jones Industrial Average has traded in a 1000+ point range. And the moves have been fast and furious, motivated by international news. As soon as something good hits the news wires, money flows in and the Dow Industrials surge and vice versa with bad news.
In the chart below, you can see this range clearly. My eyes are set on the bottom of the range, as bulls need this to hold. A break of this range will open up a slide down toward 24,000. A move over the top of the range could lead to a retest of 27,000 (which is where the market came unglued).
As an active investor, I am enjoying trading the volatility but expecting lower prices ahead to buy stocks and ETFs are lower (and more attractive) prices this fall.
Twitter: @andrewnyquist
The author may have a position in mentioned securities at the time of publication. Any opinions expressed herein are solely those of the author, and do not in any way represent the views or opinions of any other person or entity.


