The Dow Jones Industrial Average has survived several market scares over the past 5 decades, including the 1987 crash (Black Monday), Tech Bubble, Financial Crisis, and Coronavirus crash.
In a very noisy, news-driven world, sometimes it pays to simply zoom out on the charts and stop thinking about trading every headline.
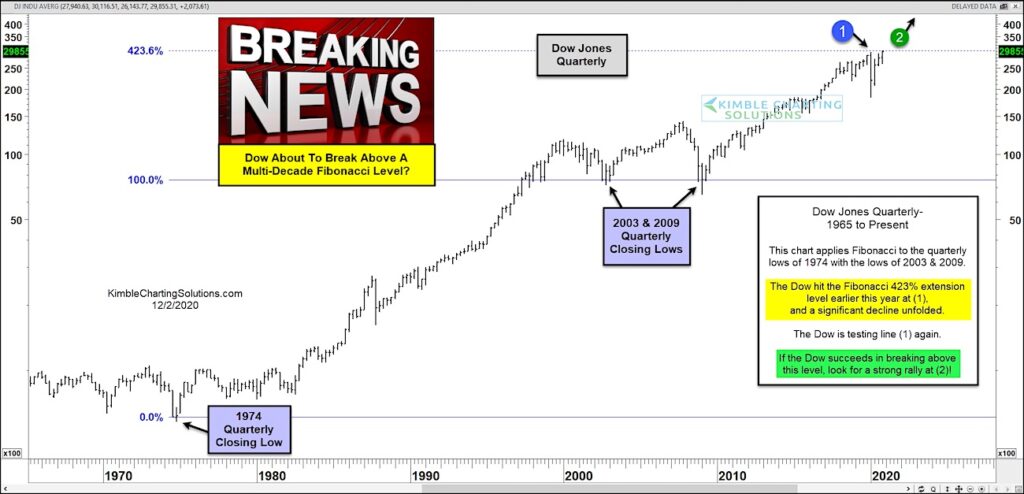
Today’s chart is a “quarterly” chart of the Dow Jones Industrial Average (spanning the past 50 years). It includes some relevant Fibonacci price levels for active investors to consider; we apply Fibonacci to the quarterly lows of 1974 and the lows of 2003 and 2009 (that being 100%).
Note that the Dow Industrials hit the 423% Fibonacci price extension earlier this year at (1) – roughly 30,000. Note as well that a significant decline followed. The Dow Industrials are testing this level again right now.
If the Dow Industrials succeeds in breaking above 30000 (on a quarterly closing basis) it could signal a super breakout and much higher prices as indicated by point (2). Stay tuned!
Note that KimbleCharting is offering a 2 week Free trial to See It Market readers. Just send me an email to services@kimblechartingsolutions.com for details to get set up.
Twitter: @KimbleCharting
Any opinions expressed herein are solely those of the author, and do not in any way represent the views or opinions of any other person or entity.

 Testing Important Price Support")
: Cup (and Maybe Handle) Watch")

