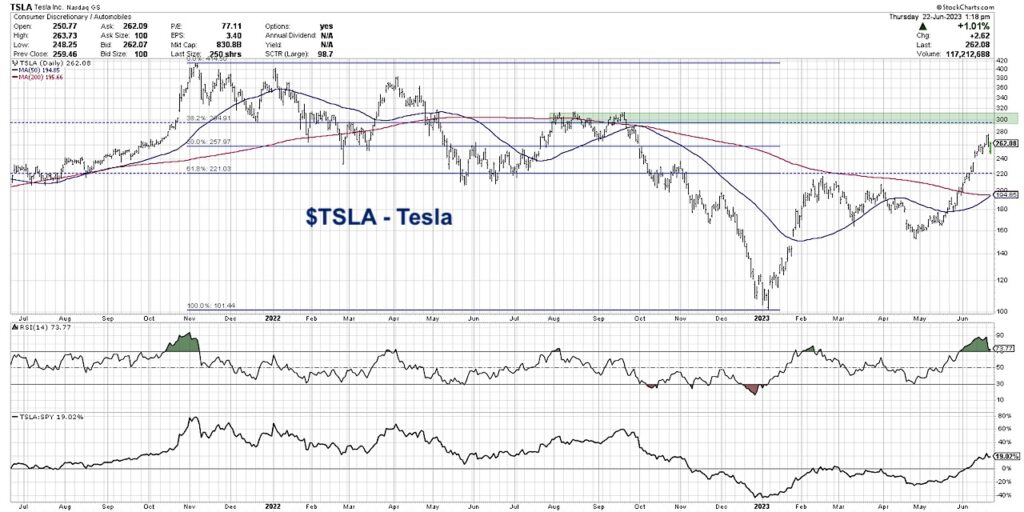
Tesla has experienced an incredible run so far in 2023, outperforming the S&P 500 by over 100% year-to-date. Now TSLA is approaching a key resistance level of around $300 based on Fibonacci Retracements and traditional support and resistance methods.
Will Tesla (TSLA) push above $300?
In today’s video, we’ll break down the chart of Tesla, track its strong performance year-to-date in 2023, and identify potential signs of a bullish exhaustion. We’ll also look back at how TSLA has performed when it has been equally as overextended after a protracted bullish phase.
- How can a Fibonacci framework help us better identify potential turning points on this key growth stock in 2023?
- What does it mean to have a “confluence of resistance” and what would that suggest for prospects for Tesla in the coming months?
What are potential short-term downside targets for this Consumer Discretionary stock if we do indeed observe a downside retracement?
VIDEO: Tesla Stock (TSLA) Fibonacci Price Analysis – Watch $300 Level!
$TSLA Tesla Stock Chart
Twitter: @DKellerCMT
The author may have positions in mentioned securities at the time of publication. Any opinions expressed herein are solely those of the author, and do not in any way represent the views or opinions of any other person or entity.


