When solar stocks rallied 30 percent from October into November, investors began wondering if a new bullish wave higher was in the works.
While that still may be the case, the Invesco Solar ETF (TAN) has given back much of those gains and finds itself at an important technical inflection point.
With near-term momentum trying to firm up, bulls are hoping for another u-turn higher. But long-term momentum is still heading lower.
Let’s review the charts.t
Note that the following MarketSmith charts are built with Investors Business Daily’s product suite.
I am an Investors Business Daily (IBD) partner and promote the use of their products. The entire platform offers a good mix of analysts, education, and technical and fundamental data.
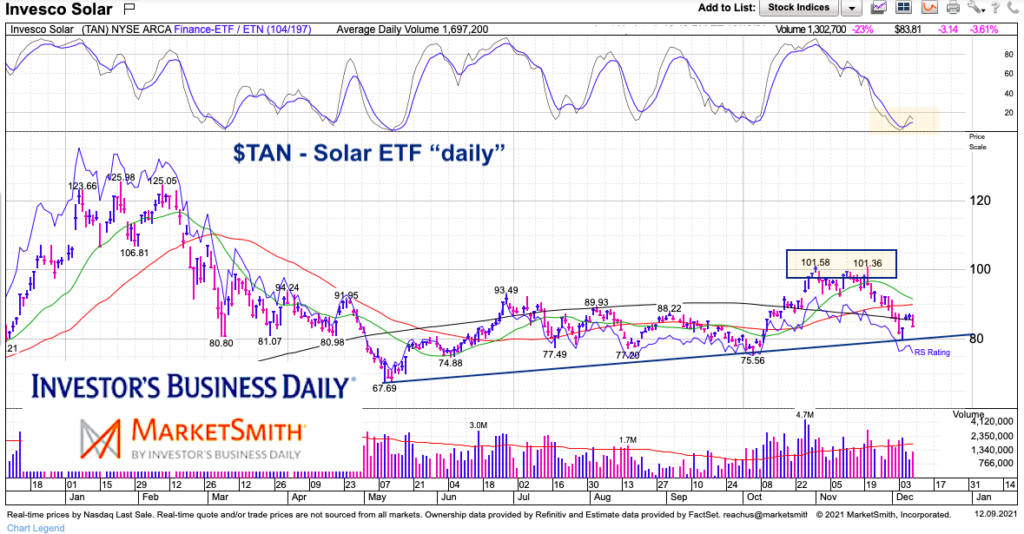
$TAN Solar ETF “daily” Chart
On the daily chart we can see that the Solar ETF (TAN) peaked in late October and double topped on lower momentum in November. This has sent TAN back down to test trend-line support. Note that momentum is trying to firm up here and may support another rally attempt if buyers emerge.
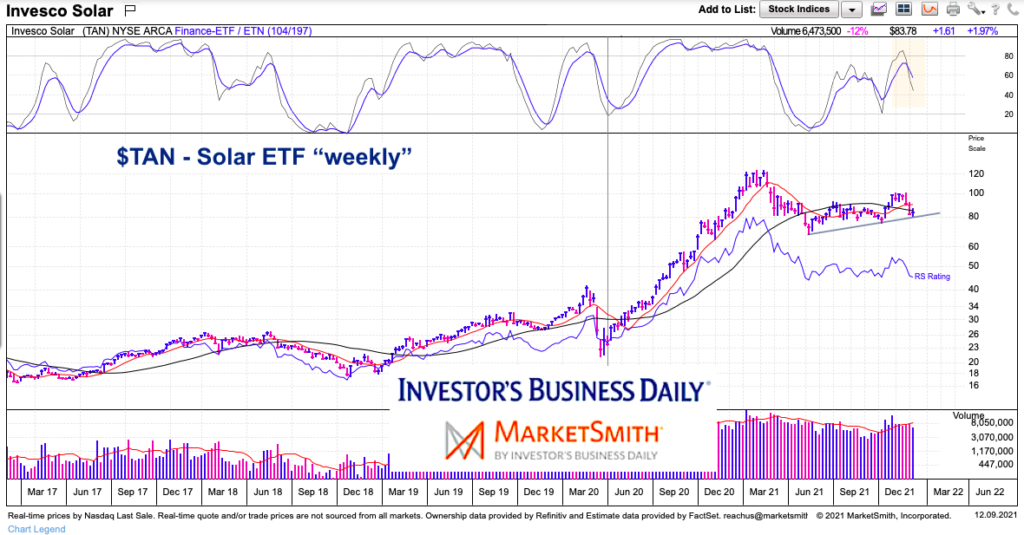
$TAN Solar ETF “weekly” Chart
A bigger issue is developing on the weekly chart for TAN. Here we can see that longer-term momentum is crossing down lower and it would take 3-4 weeks of staying power and strength to turn that back around.
So TAN has reached an important point. Put it on your watch list.
Twitter: @andrewnyquist
The author may have a position in mentioned securities at the time of publication. Any opinions expressed herein are solely those of the author, and do not in any way represent the views or opinions of any other person or entity.


