Anyone regularly checking in with the Metals complex knows that – in marked contrast to the good fortunes of Gold, Silver, Platinum and (to a lesser extent) Palladium – Copper (HG) has been under pressure since late December. Beginning overnight last Friday and then picking up speed along with drops in Aluminum, Nickel and Lead in London’s session, the industrial metal has since installed a 7.5% range, settling into consolidation this morning off almost -6% over the period to near 3.05.
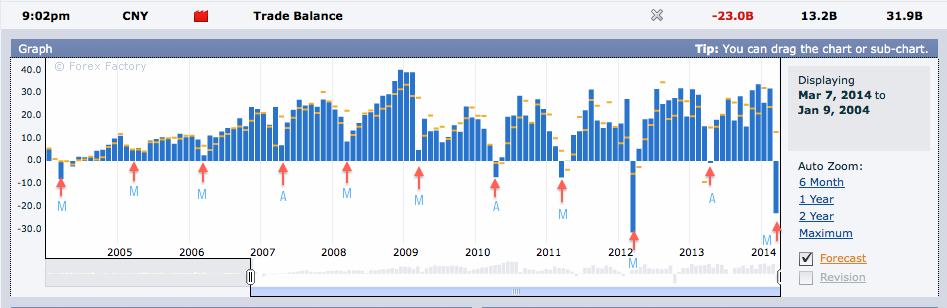
Most of the slide has been imputed to the small disaster that was China’s February Trade Balance, released late Friday night (ET) to carry the dubious distinction of the country’s second largest trade deficit on record. Parts seasonal Chinese New Year slowdown (see below) and a genuine collapse in exports, most of the decline occurred previous to the “official” release of the report.
China’s Trade Balance: Seasonality and Surge in Imports = 2nd Worst Deficit on Record
Another factor to consider: how the Chinese Yuan’s recent relative weakness exerts an adverse impact on purchasing power, new orders and organic demand for the metal in the country where massive building and infrastructure projects have acted as a seemingly bottomless demand sink for several years running.
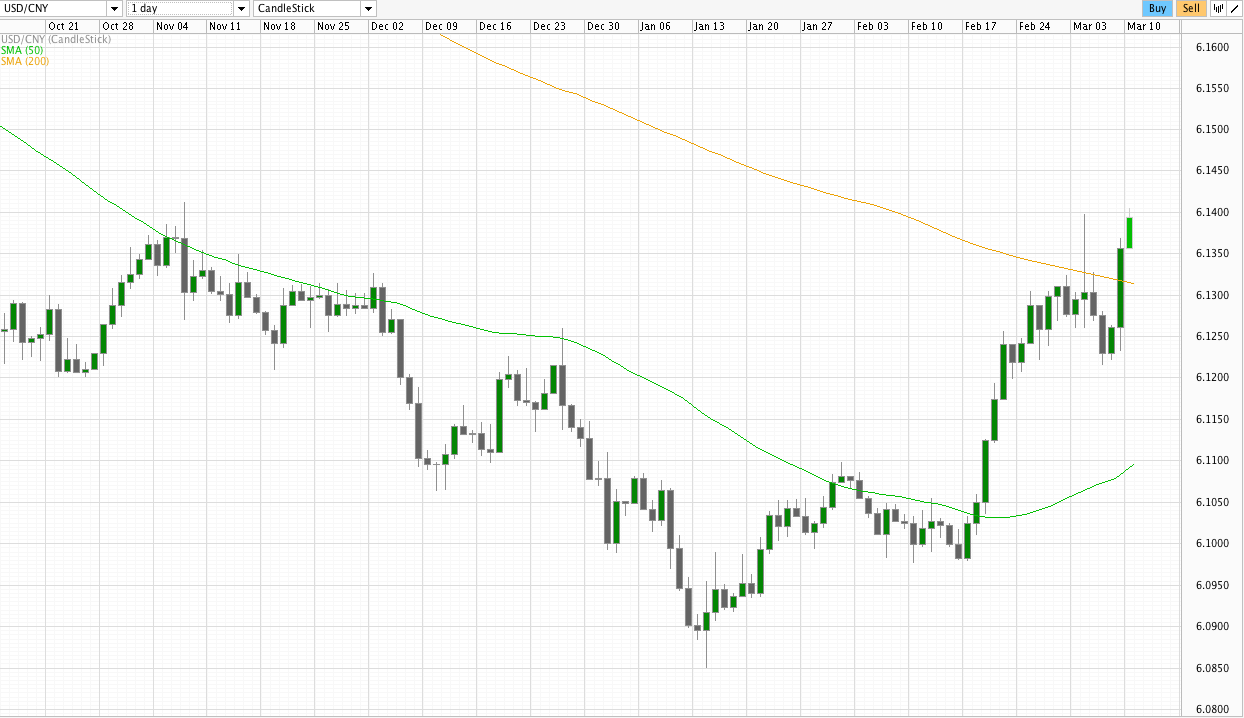
Since early January, the CNY has been losing ground against the USD, with the Greenback installing its best session since mid-July yesterday evening (Monday Beijing time) and closing above it’s 200-Day Simple Moving Average (SMA) for the first time since January 2013. Currency flows and commodity demand are subject to a feedback loop – albeit one impacted by many variables – that can result in the spiral of reciprocating reduction in demand visible now between the Yuan and Copper.
USD/CNY – Daily Chart: Recovers the 200-Day SMA in Best Session in 8 Months
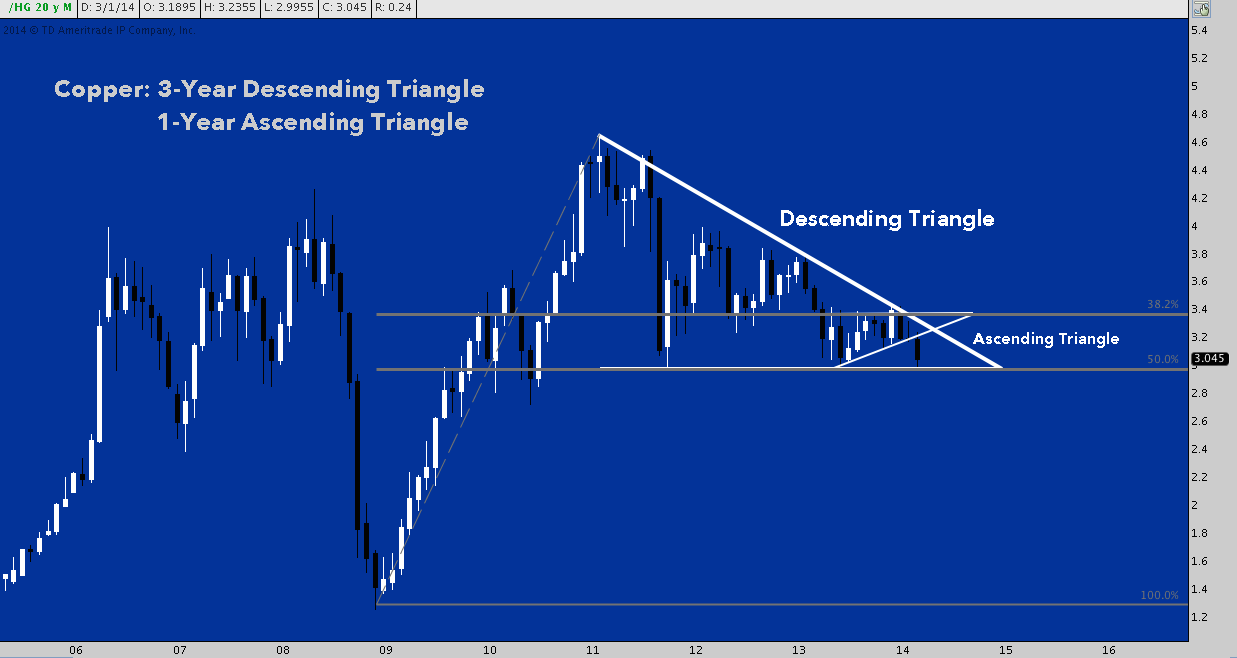
Turning to a long view of Copper itself: following 2008-2010’s 350% gain (entirely reversing and exceeding 2008’s decline) the metal has been in a protracted descending triangle consolidation for the last 3 years with a hard demand floor near 3, at the 50% retracement of the 2008-2010 range.
Copper (HG) – Monthly: Descending Triangle Support
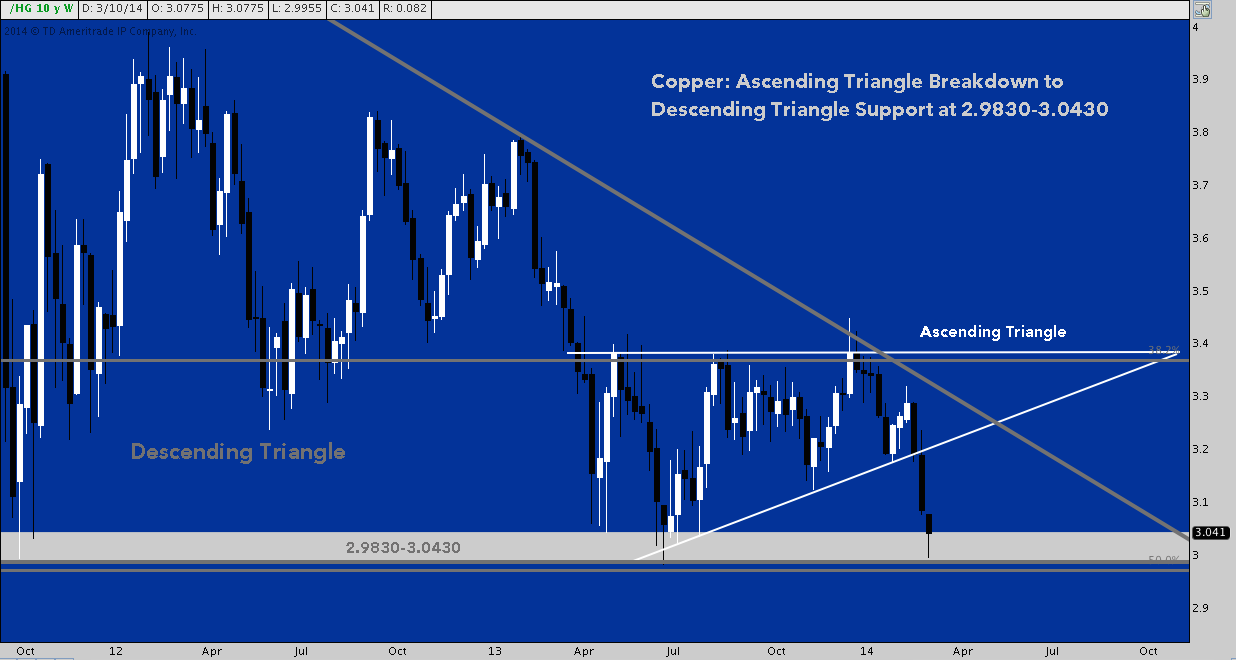
Since early 2013, the latest oscillation from that support level to falling trend line resistance has created an ascending triangle. It’s readily evident in the chart below that abrupt and dramatic declines in Copper are common (not for the faint of heart; or those without a discipline incorporating hard stops). The latest cliff dive is unique because it brings the contract back to descending triangle support, dialed in more precisely here as 2.9830-3.0430. The “3” level has been a major price fulcrum since 2006; but it’s only since the swing low in October 2011 that this area has taken on the tone of a very tight support zone.
Copper (HG) – Weekly: Ascending Triangle Breakdown to Support Around 3
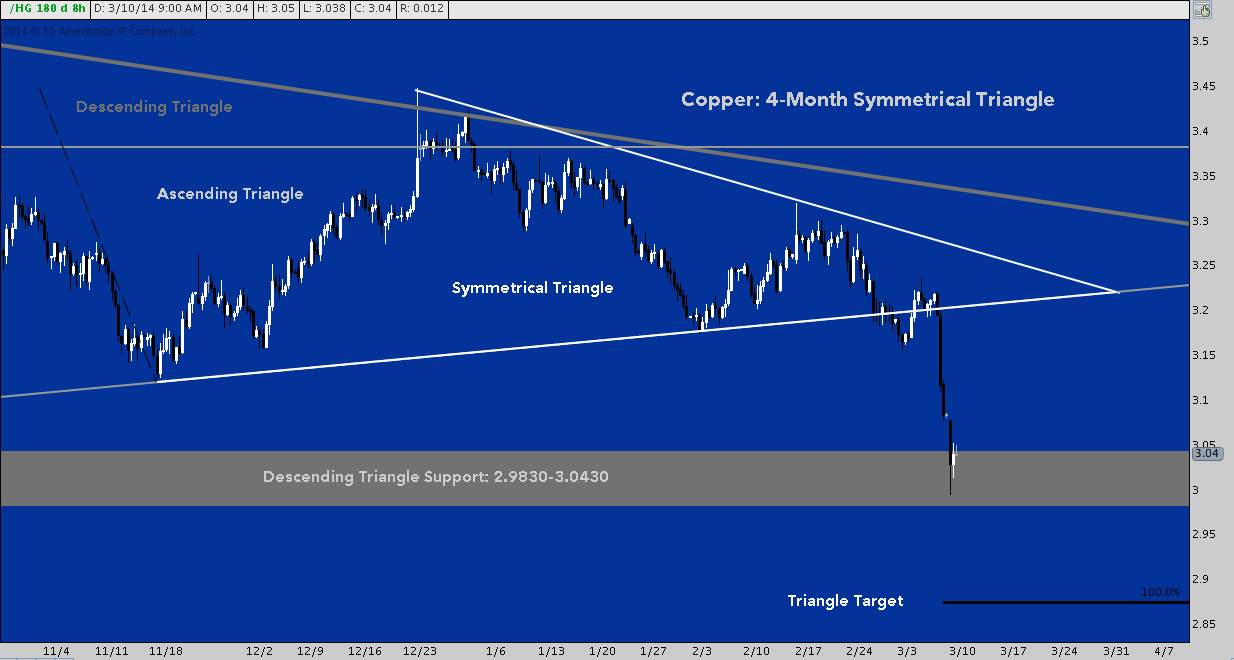
Copper (HG) – 8-Hour: Symmetrical Triangle
Looking still closer, HG‘s 8-hour chart shows a 4-month symmetrical triangle (also possibly rendered as an Head & Shoulders continuation) pattern that experiences a false break and throwback in late February; only to turn Friday and move aggressively lower. With the massive caveat that is “3” is in the way, the triangle’s target lies near 2.87.
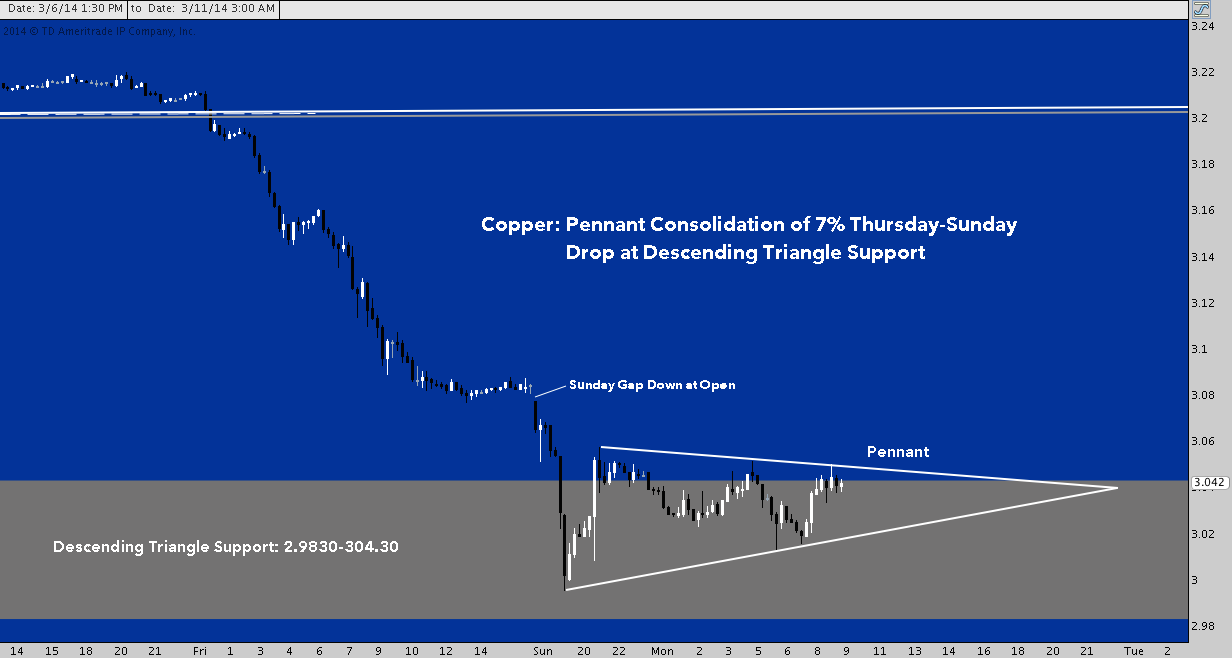
Copper (HG) – 15-Minute: Pennant Consolidation
One last, granular look at Copper’s 15-minute chart shows the initial drop into the descending triangle support zone and the subsequent consolidation over the last 12 hours into a pennant.
Does this latest drop in “Dr. Copper” have ominous portent for global equities? Yes and no. Though the correlation is by no means flawless, Chinese stocks (e.g. the Shanghai Composite, SSEC, represented below by FXI) tend to track Copper’s behavior closely: it’s no coincidence both topped in 2011 and have since fared badly in a staggered and protracted decline. On the other hand, US stocks (SPY) shared a very tight positive correlation to HG (more so than SSEC) until early 2012, and in a major change of character almost completely decoupled beginning in late 2012. The two asset classes have spent the latter half of 2013 to February 2014 building back from a deeply negative to random correlation. 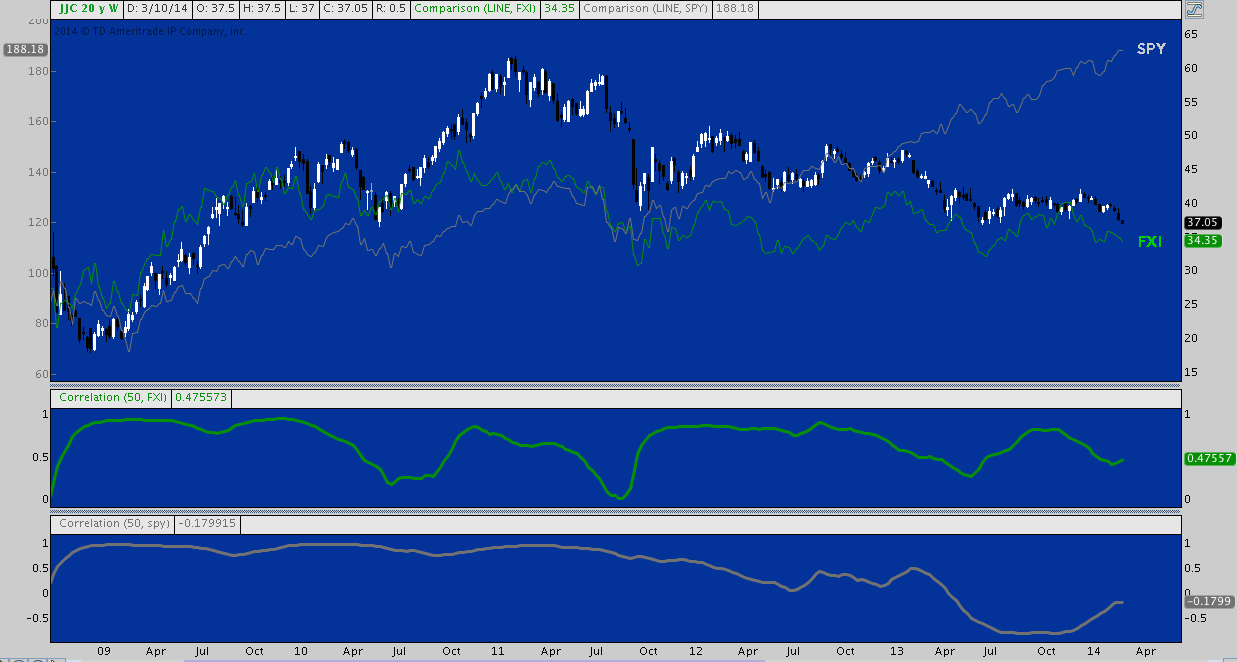
A drop through “3” would signal the end of Copper’s post-2008 consolidation and no doubt be indicative of escalating under performance in Chinese equity markets and its broader economy. Should the S&P 500 continue higher, the divergence that became so evident in early 2013 will resume.
The question lingers, however: If Copper declines and the SSEC – already -18.2% since last year’s top near 2450 – goes with it, can the US economy and stocks remain above the fray? Doctor Copper’s prognosis suggests that if the second largest economy in the world continues to sneeze, global markets aren’t likely to avoid catching a cold.
Twitter: @andrewunknown and @seeitmarket
Author carries no position in the instrument(s) mentioned at publication. Commentary provided is for educational purposes only and in no way constitutes trading or investment advice.
Charts courtesy of Oanda, Forexfactory and ThinkorSwim
Any opinions expressed herein are solely those of the author, and do not in any way represent the views or opinions of any other person or entity.


