So just how tough has it been for diversified investors in 2015? Think about it, stocks and bonds are flat, cash makes you nothing and commodities tanked once again.
Most years being diversified is the way to go. But this year has been historically tough on diversified investors.
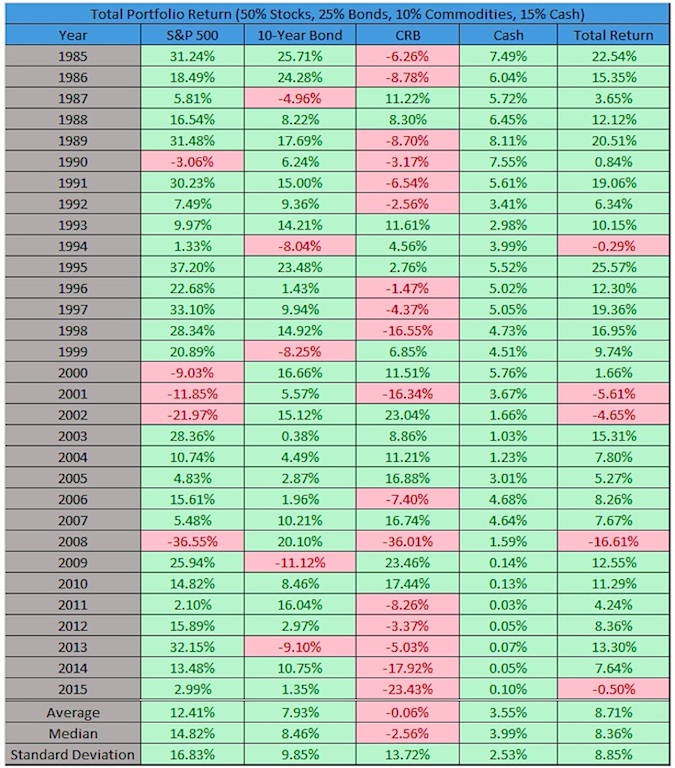
I took a look at various asset class returns over the past 30 years and made some hypothetical portfolios for each year. I put 50 percent into the S&P 500 (stocks), 25 percent into 10-yr bonds (bonds), 10 percent into commodities, and 15 percent into cash.
With a couple days to go, diversified investors are down 0.50% in 2015. That’s the worst year since 2008 and one of the worst performing years going back 30 years.
A few thoughts on the above chart and example.
- Even with two historic bear markets and the worst one day crash ever, the S&P 500 is still up +12% (with dividends) on average going back 30 years.
- Commodities are down on average the past 30 years.
- Commodities are down five straight years for the first time ever.
- A diversified portfolio returns nearly nine percent on average and has a lower standard deviation than either stocks or bonds.
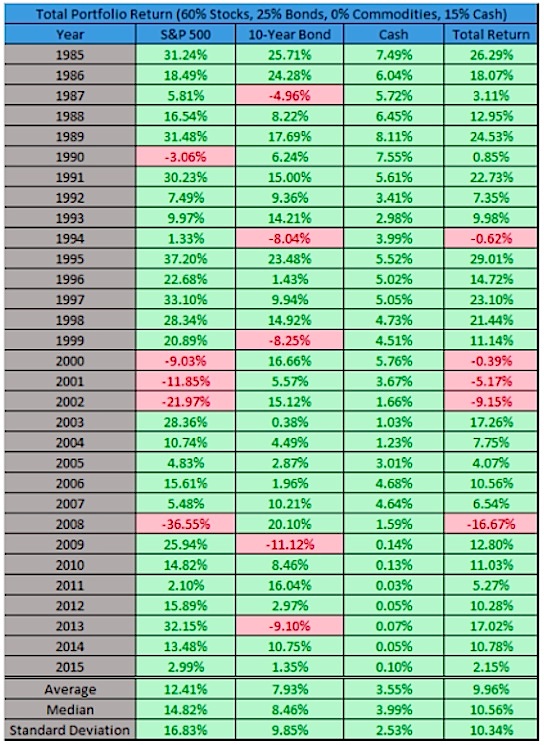
Just a hypothetical here, but what if we took out commodities? I’m aware doing something like this is by itself a big buy signal, but I’ll do it anyways. The average for a diversified investors portfolio goes up to nearly 10 percent a year under this scenario. Check out the chart below.
Thanks for reading and best of luck with the market into 2016.
Twitter: @RyanDetrick
Any opinions expressed herein are solely those of the author, and do not in any way represent the views or opinions of any other person or entity.


