Did the coronavirus crash mark the end of the U.S. treasury bond bull market?
Bonds raced higher as interest rates crashed (inverse correlation). Interest rates are at historic lows… perhaps there is nowhere to go but up in the years ahead.
Today, we simply look at the short and intermediate term trends for the long-term 20+ year US treasury bond ETF (TLT). We look “daily” and “weekly” charts and simply highlight the trends in motion and why moving averages matter.
Note that the following MarketSmith charts are built with Investors Business Daily’s product suite.
I am an Investors Business Daily (IBD) partner and promote the use of their products. The entire platform offers a good mix of analysts, education, and technical and fundamental data.
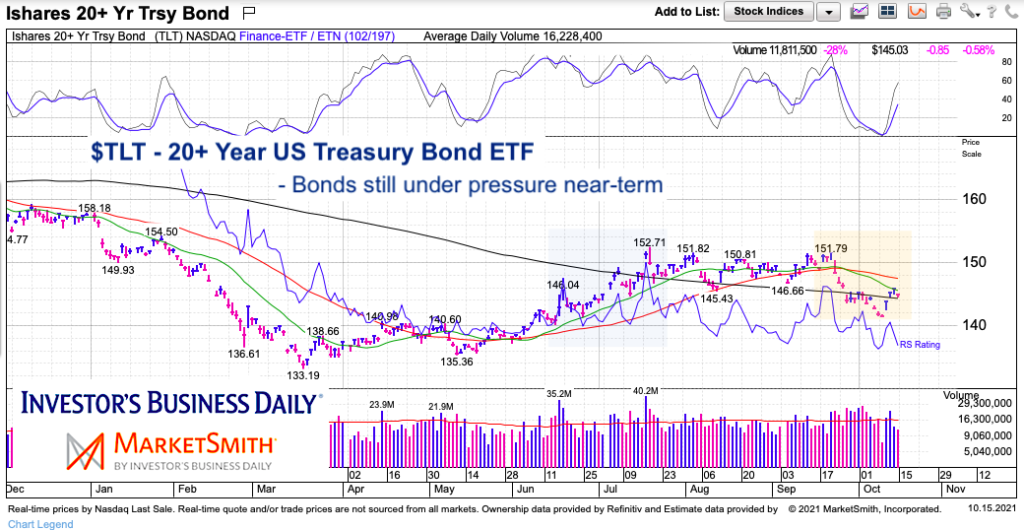
$TLT 20+ Year US Treasury Bond ETF “daily” Chart
The “daily” chart captures the past year. As you can see bonds were still coming down from the coronavirus peak.
More importantly, we can see the “short-term” trend changes over the past several months. The first came in May when TLT made a higher low and the 20/50 day moving averages turned higher. This lead to the July peak… and it wasn’t until September that the 20/50 day moving averages turned lower (changing the short-term trend again).
And even more importantly, we can see that the broader trend DID NOT change. The 200-day moving average has been sloping lower throughout the year. This means that the bears are still in control and the bulls would need to mount another rally to flatten the average.
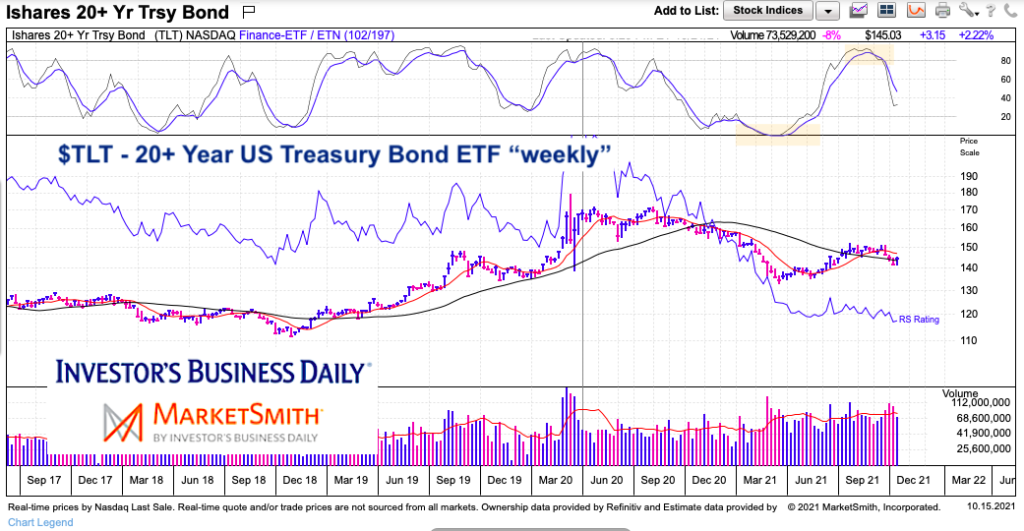
$TLT 20+ Year US Treasury Bond ETF “weekly” Chart
The “weekly” chart confirms that bears are still in control, with the 10-week moving average curling lower and the 40-week moving average sloping lower. We can also see that momentum peaked last month and is yet to stabilize. To be clear, that could change if bulls can re-group… but we haven’t seen it yet.
Twitter: @andrewnyquist
The author may have a position in mentioned securities at the time of publication. Any opinions expressed herein are solely those of the author, and do not in any way represent the views or opinions of any other person or entity.

: Cup (and Maybe Handle) Watch")
 Trading Near Top Of Price Range")

