Crude is making noise to the downside once again.
The story of 2017 so far is that Saudi Arabia told OPEC it raised output above 10 million barrels a day back in February. This is significant as this reverses about 33% of the cuts from the prior month.
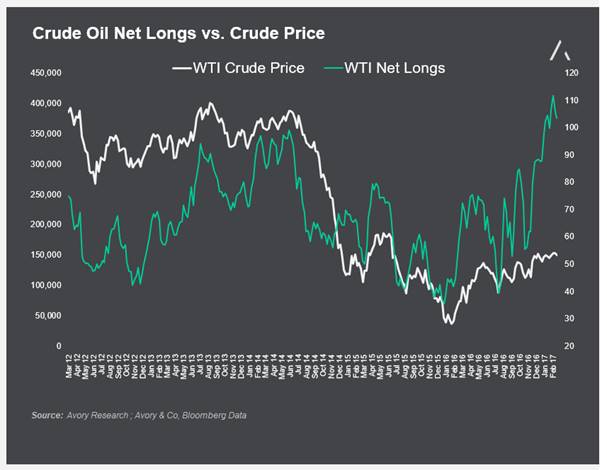
This is also important based on the current positioning of oil investors. The chart below highlights how current oil positioning is extremely net long, even more long then heading into the oil self-off in 2014-2015.
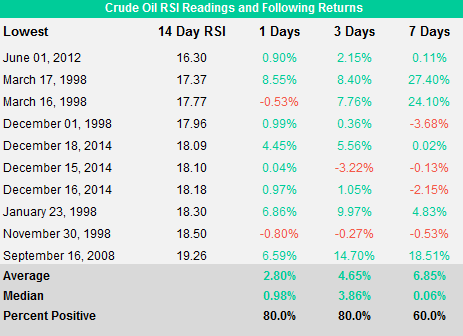
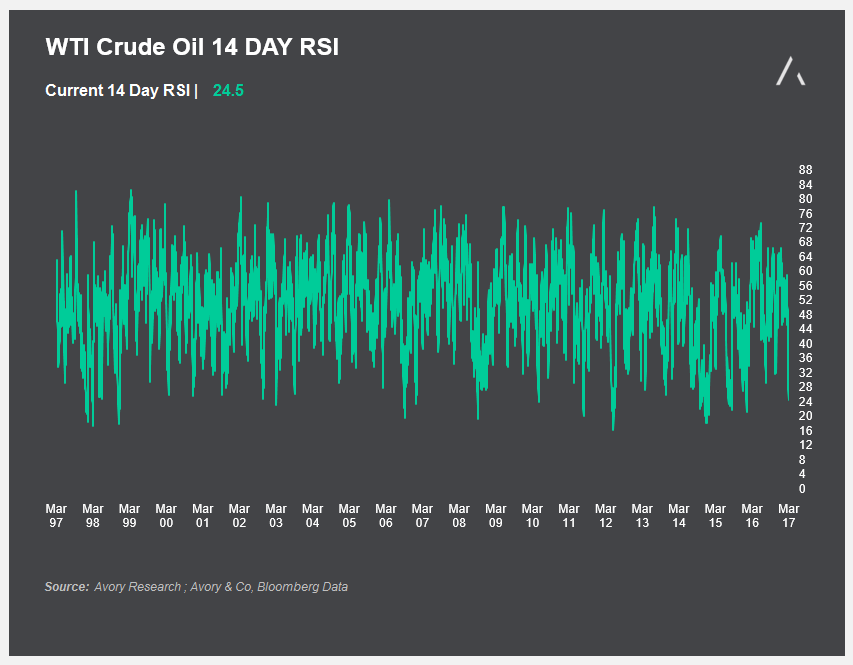
With the crude sell-off, the relative strength index (RSI) is now sitting at 24.5. A reading under 30 is typically viewed as oversold conditions. As shown below, the reading begins to get very interesting when RSI drops below 20. The table highlights the lowest readings over the last 20 years. Using the top 10 lowest RSI readings, the returns on a 1/3/7 day trading basis are 2.8%, 4.65%, and 6.85% on average, respectively.
Here is a look at the RSI reading over the last 20 years. While we are low, it is clear we can in-fact move lower.
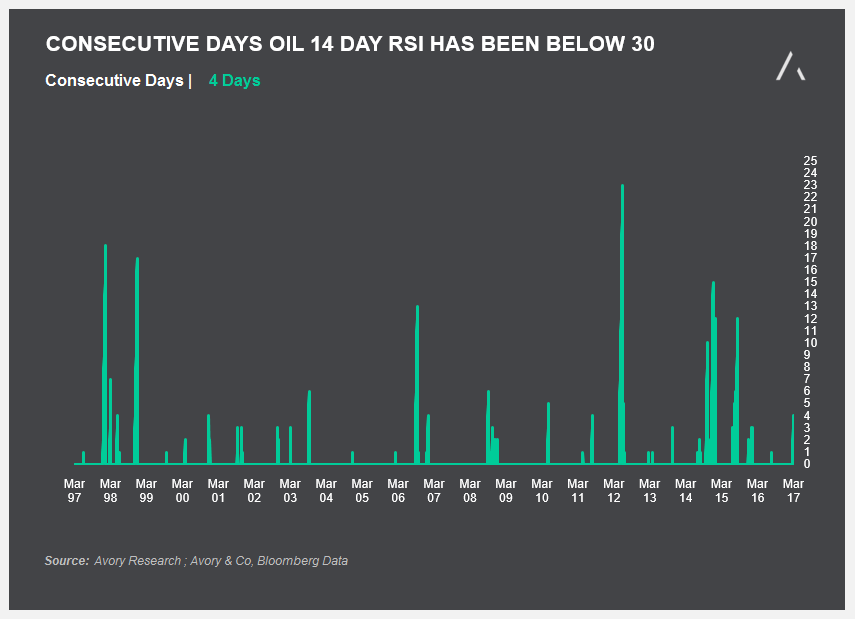
Furthermore, RSI can stay low for long periods of time. As of today, we have seen a reading of sub-30 for 4 days in a row. Back in 2014-2015, we saw numerous periods of over 10 consecutive days in a row of RSI readings under 30.
My overall observation therefore is that while oil seems to be oversold in the near-term. This can actually linger on for longer periods, and also hit further lows in the reading. Combined with an overly bullish net long positioning and a changing stance from Saudi Arabia, it may be more prudent to wait for more extreme readings to play a bounce.
Thanks for reading.
Twitter: @_SeanDavid
Read more from Sean on his blog, the Market Meter.
Any opinions expressed herein are solely those of the author, and do not in any way represent the views or opinions of any other person or entity.


