Commodities prices have rallied sharply higher into 2021, lead recently by energy and grains.
Today, we focus in on one universally important commodity: Crude Oil.
As you know, Crude Oil is heavily watched due to its importance to the economy, prospects of inflation, as well as how investors perceive the stock market. Today is no different… especially because the rally in crude oil is testing a very important price resistance area this month.
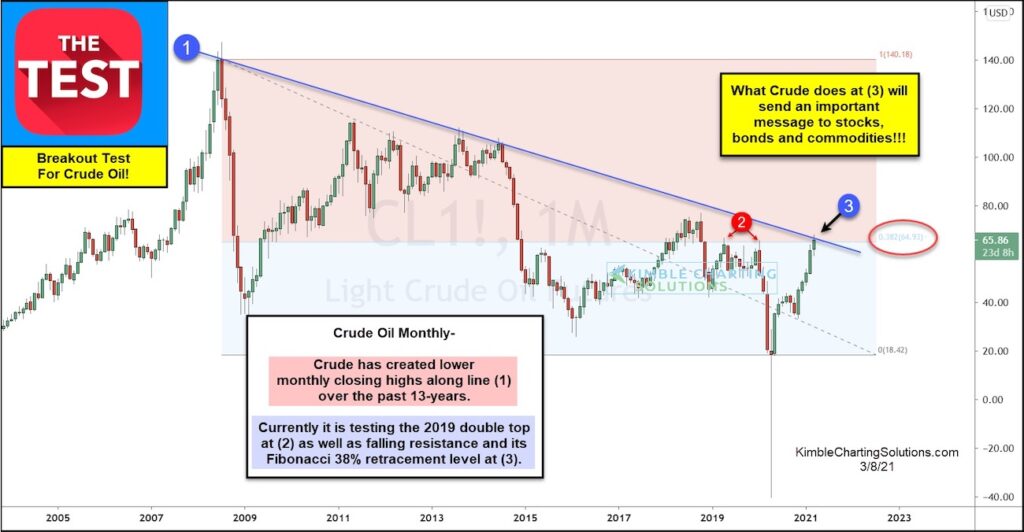
The long-term “monthly” chart of Crude Oil (below), highlights a major breakout test this month. Not only is Crude Oil testing its long-term down-trend line at (1), but also the 2019 double top at (2) and the 38.2% Fibonacci retracement level at (3). Wow, that’s one heck of a confluence of price resistance!
Will oil prices cool off… or breakout?
What crude oil does at (3) will send an important message to investors around the world. Stay tuned!
Crude Oil “monthly” Price Chart
Note that KimbleCharting is offering a 2 week Free trial to See It Market readers. Just send me an email to services@kimblechartingsolutions.com for details to get set up.
Twitter: @KimbleCharting
Any opinions expressed herein are solely those of the author, and do not in any way represent the views or opinions of any other person or entity.


: Showing Some Signs of Emerging Strength")
