Inflation has been a growing worry for investors and consumers alike. And Thursday’s Consumer Price Index (CPI) data didn’t help, showing a 7.5% spike higher.
One area that has consumers concerned is energy prices… and they have been rising for several months.
And, according to Joe Friday, crude oil (and by extension, gasoline prices) could surge if they breakout above key price resistance level.
This price area we will refer to as the “super breakout resistance level.” And it can be seen on today’s long-term “monthly” chart.
So how did we get there and why is this level “super” important?
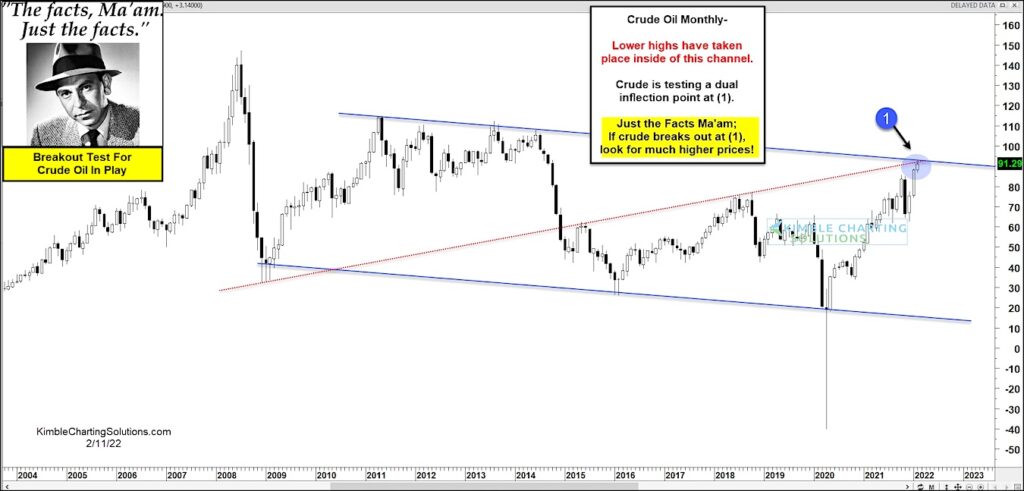
“The facts, Ma’am. Just the facts.”
As you can see in today’s chart, crude oil has produced a series of lower highs and lower lows over the past decade+, creating a long-term falling channel.
Currently, the rally in crude oil has this key inflation input testing the topside of this channel at (1). This resistance area is also fortified by another overhead trend line (in red).
So what’s this all mean? Well, crude oil could take a breather here… OR it could breakout at (1) and head for MUCH higher prices!
This is an important test for Crude Oil that has inflation implications for investors and consumers alike. Stay tuned!
Crude Oil “monthly” Price Chart
Note that KimbleCharting is offering a 2 week Free trial to See It Market readers. Just send me an email to services@kimblechartingsolutions.com for details to get set up.
Twitter: @KimbleCharting
Any opinions expressed herein are solely those of the author, and do not in any way represent the views or opinions of any other person or entity.

: Worrisome to Broader Market?")

