What can you do when the market goes hard against the trade you just entered? Here we revisit our February post about crude oil futures (symbol CL) to show how Elliott wave gives you tools to minimize your losses and get onto the right trade.
We try to avoid attaching news headlines to our analysis, but sometimes real-world events overtake our forecasts. That was the case when CL shot to 130.20 in recent weeks, far above our expected resistance bands.
Ideally a bearish oil trader would have waited for a lower high to print on some sub-weekly time frame (perhaps on a daily chart) before making an entry. That one rule would have kept most bears from being burned. The same rule also might have drawn a bear into the market closer to 130 unless they were understandably too skittish in the current environment.
There was a potentially lower high of 94.31 on February 25 that might have lured a bearish trader into the market. In the subsequent days, as price resumed its rally, the unfortunate bear could have exited the trade with a relatively small loss as soon as CL exceeded the previous high of 99.21. (If the bear had been counting waves on a daily chart, they also would have noticed there was not yet a completed upward impulse from the low of February 9. That might have kept them out of the losing trade.)
A bullish trader might have tried a break-out entry after a daily close above our highest resistance at 104.15. But if that trader paid attention to Elliott wave, they would have known that there was already a nearly complete impulsive (five wave) structure up from the December low. Any upward continuation in the fifth wave of that sequence was destined to be brief, even though it turned out to be powerful. Nimble bulls would have taken profits quickly, within a day or two.
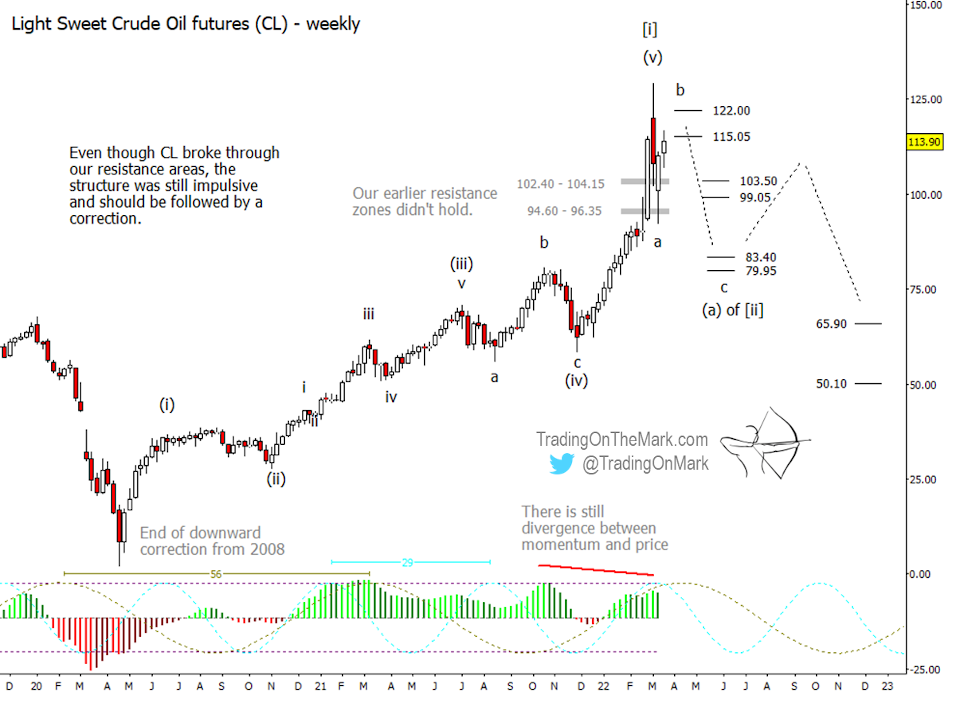
Now we see price trying to make the correction we expected a month ago. The correction should consist of a three-wave pattern or a series of such. We have drawn the most common scenario on the weekly chart above.
Nearby resistance for the middle wave ‘b’ of the correction sits at 115.05 and 122.00. Downward wave ‘a’ should be a fairly strong move that traverses a price range similar to that of downward wave ‘a’. We have preliminary targets for ‘c’ at 83.40 and 79.95, and additional support near 103.50 and 90.05 that could act as barriers along the way.
There’s another scenario, not shown here, where the recent low that’s labeled as ‘a’ might instead be a fourth wave that precedes yet another new high. Going forward, the trading rules described above still apply, along with all the other tricks and advantages Elliott wave can offer.
The currently dominant 29-week price cycle, shown in blue on the chart, suggests an ideal time for a low around June.
You can get daily charts and updates for this and other highly traded markets via our subscription page on Substack and on Twitter.
Twitter: @TradingOnMark
The authors may have a position in the mentioned securities at the time of publication. Any opinions expressed herein are solely those of the author, and do not in any way represent the views or opinions of any other person or entity.


