This post was written with Chris Kerlow of Richardson GMP.
Crude Oil: A lot Can Change In Just 3 Years…
In the 1st half of 2014, the outlook for oil was bright. Prices were rising, companies were investing and free cash flow was gushing. The good times were expected to last; on June 30th, 2014, the average analyst forecast for oil prices (West Texas Intermediate) was to remain above $92 through 2017.
Unbeknownst to most, the world was on the verge of an epic battle among oil producers who sought to increase production and market share. Supply was rising faster than demand and people were starting to worry about a ballooning oil inventories.
Saudi Arabia, haunted by its past mistakes and determined to maintain market share, chose not to cut production to address the glut and instead continued to pump. The goal being to push higher cost shale production out of the market. These developments led to a massive slide in oil prices, which fell from over $100 in the 1st half of 2014 to a low of $26.05 on February 12th, 2016; the point of maximum pessimism. Subsequently, oil rebounded as sentiment improved. U.S. production began falling and some investors hoped that OPEC would intervene. That is exactly what they got in November 2016, when OPEC agreed to curtail production. The agreement pushed WTI above $50 a barrel, where it held until March this year. Optimism was back in the market that rebalancing was on the way, OPEC was helping and supply would fall below demand, to help address the global glut in oil inventories.
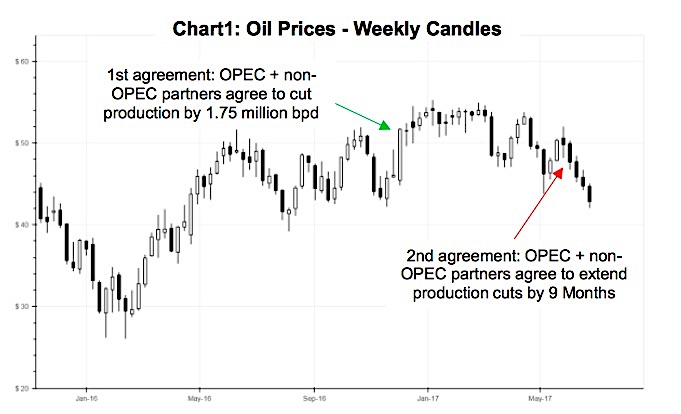
Recently this optimism began to fade. U.S. production was rising again and there were concerns that OPEC members who were exempt from the production quota might offset Saudi Arabia’s best efforts. Rebalancing has been moving farther away and sentiment has been worsening. On May 25th, OPEC and non-OPEC members agreed to extend production cuts for nine months. Unfortunately, that was not enough for the market (Chart 1 below). As we write, oil has fallen to $43.18. That is 22% lower than the high of $55.25 on January 3rd, 2017. Prices have fallen back into a bear market and we are concerned about more downside. Still, our recommendation is the same as it was on January 30th, stay underweight energy and focus on defensive names.
Crude Oil Supply
In May, OPEC and its non-OPEC partners showed record compliance with the deal to cut production. Reuters’ data shows that OPEC compliance, driven largely by Saudi Arabia, was 108%. In other words, the group reduced production by more than it initially agreed to. Non- OPEC (Russia, Mexico, etc.) compliance was 100%. Even so, that may not be enough. Iraq has only achieved a 55% compliance rate this year while Venezuela & the UAE have been less than perfect. Countries such as Nigeria and Libya, which are exempt from the deal, have been increasing production.
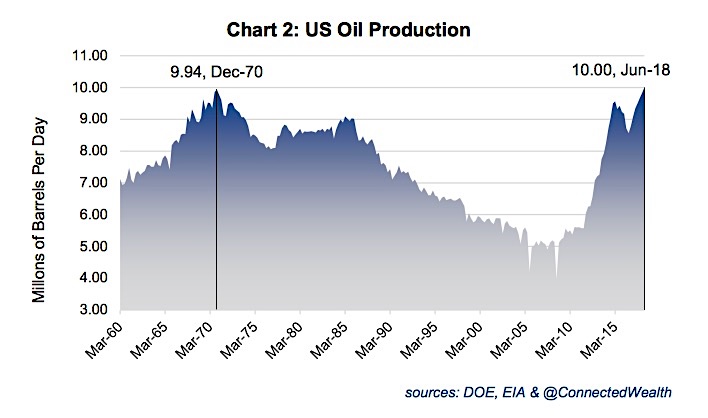
U.S. output has also been growing. It rose to 9.35 million barrels per day (bpd) in the week ended June 16th, 2017. Moreover, the EIA now expects that U.S. production could reach 10 million bpd in 2018, eclipsing the previous record of 9.94 million bpd which was set back in December of 1970 (Chart 2 below).
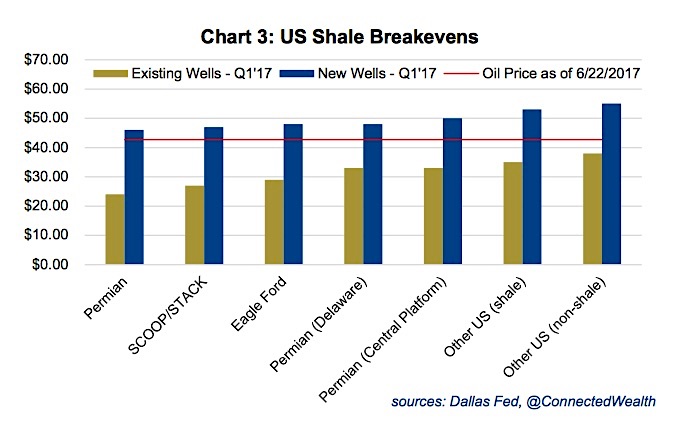
The shale revival has been driven by efficiency. Technological improvements have allowed U.S. companies to raise output at lower costs. As a result, many wells that were not previously economically viable are now, even with oil around $50. According to the Dallas Fed, the average prices needed to cover operating expenses at existing wells range from $24 to $38. In other words, many existing wells are at least breaking even at today’s prices. The same does not apply for new wells, which break even from $46 to $55 (Chart 3 below). If oil stays at current levels or falls below then drilling activity will probably slow down. That said, with better operating margins and lower cost structures, it is likely that production will be more resilient than it was last time around.
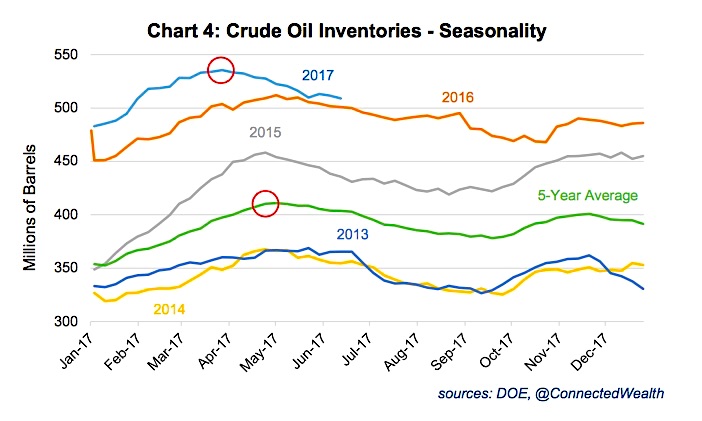
U.S. inventories have been falling since the end of March. That is supportive; however, they remain well above 5-year averages. In addition, the typical pattern is for inventories to peak in late April / early May and then draw down into the fall. This year, the draw started earlier, which is partially attributable to record refinery throughput (Chart 4 below). On a bigger scale, OECD inventories have actually grown 360,000 bpd in 2017. They now stand at 250 million barrels above their 5-year average. Non-OECD stocks and floating storage fell in the 1st quarter of 2017; however, the latter is now rising.
The one wild card is Saudi Arabia. The kingdom wants to diversify its economy by investing in non-oil sectors. Unfortunately, the downturn in oil prices has left Saudi Arabia cash-strapped. In order to achieve its goals, Saudi Arabia needs its crown jewel, Saudi Aramco, to have a successful IPO. Aramco’s valuation is highly dependent on oil prices. Thus, it is reasonable to assume that the kingdom will do whatever it takes to support them. At present, Saudi Arabia is cutting ~600 thousand bpd. In the 1980s, the kingdom curtailed production by more than 6.7 million bpd. Although improbable, a further reduction in output is not out of the question. If that did occur then rebalancing would be pulled forward, sentiment would improve and prices could skyrocket.
continue reading this article on the next page…

: Cup (and Maybe Handle) Watch")
 Reaches Important Price Support")

