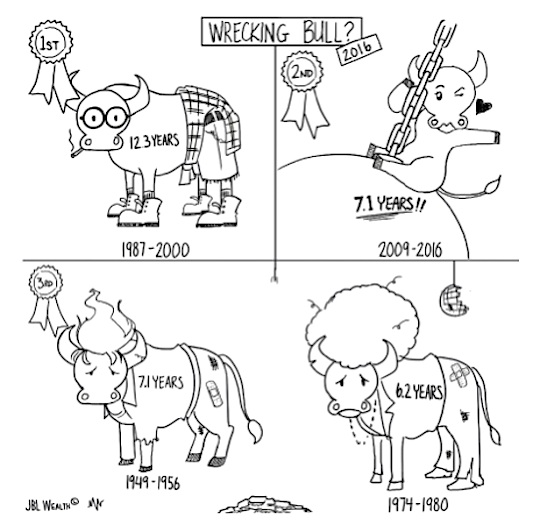
What went unnoticed Friday, April 15th is the bull market became the second longest on record.
As discussed in Stock Market Time Lapse: Tantrums, Reflux and Dilemmas, daily fluctuations in crude oil prices have been the tail that wags the market dog in 2016. On February 11th, 2016, with West Texas Intermediate setting a 13-year low in the mid-$20s, and the S&P 500 hitting 1810.1 (down 12%+ in six weeks), the United Arab Emirate’s oil minister said that “OPEC is ready to cooperate on a production cut”, halting oil and the S&P 500’s slide in their tracks.
In following days, Saudi Arabia and Russia agreed to tentative oil production “freeze” and for a moment Iran did too. Since the UAE oil minister’s comments, crude oil prices are up 60% and the S&P 500 is up 15%.
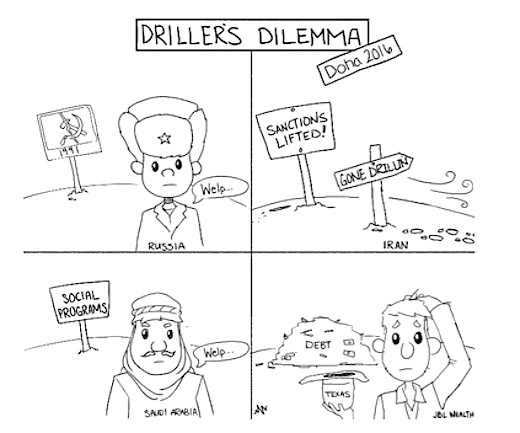
But, as I noted then, there is a Driller’s Dilemma, where, as oil prices rise who is incentivized to “freeze” production given their dire individual circumstances? Tough question put to OPEC this past weekend.
Sunday, at a very much anticipated meeting of 20 leading oil exporters in Doha, Qatar, an agreement on a formal freeze was unable to be reached; and, Iran was a notable no show.
What does this mean for markets and oil prices? Well, my initial thought was negative, (i) but Kuwaiti oil strikes, (ii) increasing bullish sentiment on declining production in the U.S. and elsewhere, and (iii) dovish commentary from Fed Dudley appear to have countered the “failure to freeze” and squeezed shorts…for now.
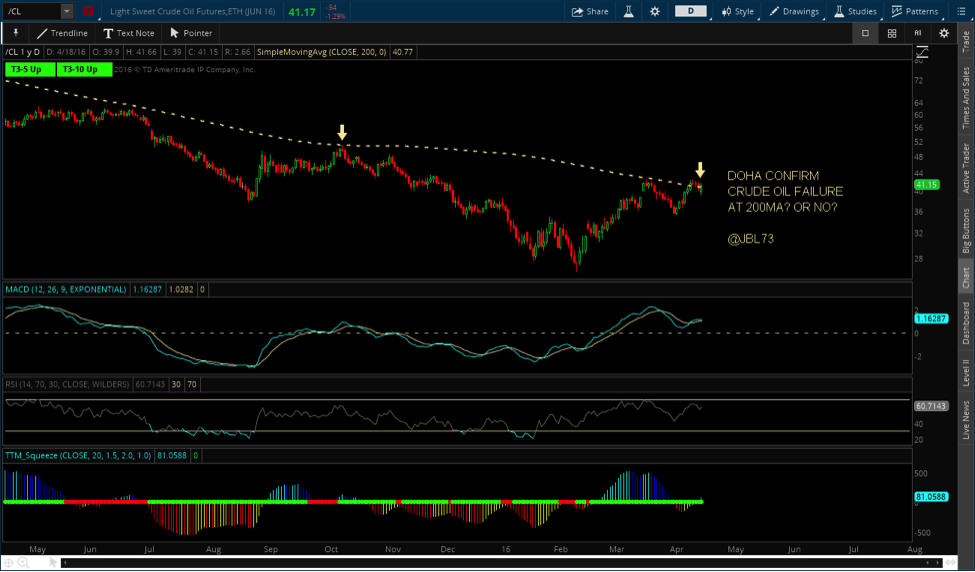
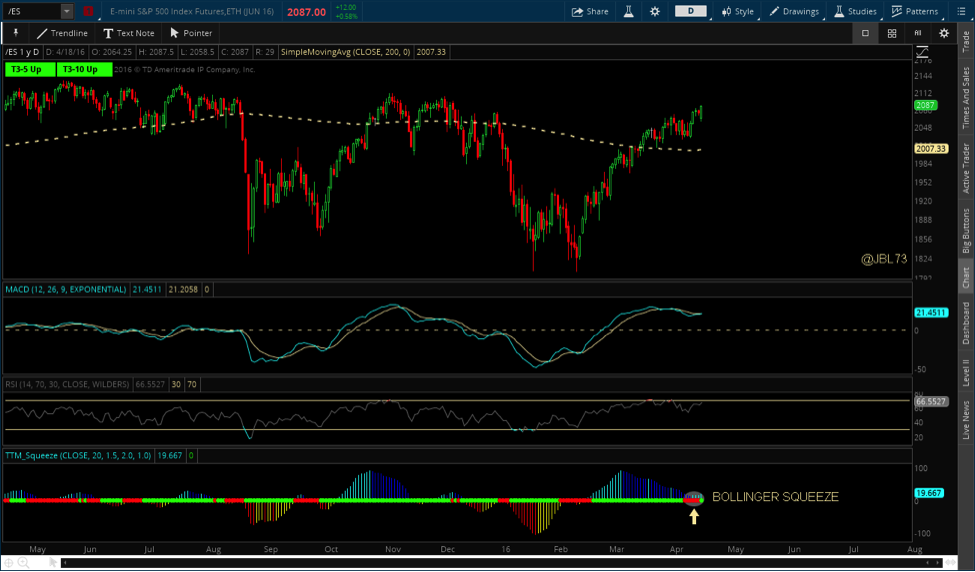
What I am watching: (i) the oil/stock market correlation has yet to be been broken, (ii) crude oil’s success/failure at 200-day moving average and its impact on (iii) a short term Bollinger squeeze and release in the S&P 500.
WTI Crude Oil Futures (Daily)
Daily (short-term) Bollinger squeeze fired (S&P 500 Futures – Daily)
Thanks for reading. You can visit our site to learn more about our TREND and MOMENTUM strategies.
Disclaimer from the author:
JBL WEALTH ADVISORY IS A REGISTERED INVESTMENT ADVISER. INFORMATION PRESENTED IS FOR EDUCATONAL PURPOSES ONLY AND DOES NOT INTEND TO MAKE AN OFFER OR SOLICITATION FOR THE SALE OR PURCHASE OF ANY SPECIFIC SECURITIES, INVESTMENTS, OR INVESTMENT STRATEGIES. INVESTMENTS INVOLVE RISK AND UNLESS OTHERWISE STATED, ARE NOT GUARANTEED. BE SURE TO FIRSTCONSULT WITH A QUALIFIED FINANCIAL ADVISER AND/OR TAX PROFESSIONAL BEFORE IMPLEMENTING ANY STRATEGY DISCUSSED HEREIN. OPTIONS STRATEGIES ENTAIL DIFFERENT FORMS OF RISK. COVERED CALL WRITING MAY LIMIT THE UPSIDE POTENTIAL OF OUTRIGHT OWNERSHIP OF A SECURITY IN A GENERALLY RISING MARKET. SELLING PUTS COULD REQUIRE AN INVESTOR TO PURCHASE A STOCK AT A MUCH HIGHER PRICE THAN THE PREVAILING PRICE OF THE STOCK IN A MARKET SELLOFF. EXAMPLES PRESENTED ASSUME THE ABILITY TO CONSISTENTLY SELL OPTIONS AT A SPECIFIC PREMIUM AND MAINTAIN OWNERSHIP OF THE STOCK IN A COVERED CALL SCENARIO OR NOT HAVE TO PURCHASE STOCK IN A CASH SECURED SELL PUT SCENARIO. ALL RETURNS ARE NET OF MANAGEMENT FEES.
Twitter: @JBL73
Any opinions expressed herein are solely those of the author, and do not in any way represent the views or opinions of any other person or entity.


