Late last week, crude oil price (WTI) reached my pullback target between $34 and $36/barrel and has broken its recent downtrend. You can read my previous piece on crude oil/energy here: Crude Oil And Energy Sector May Need To Refuel.
This should bode well for both crude oil prices and energy stocks over the near-term.
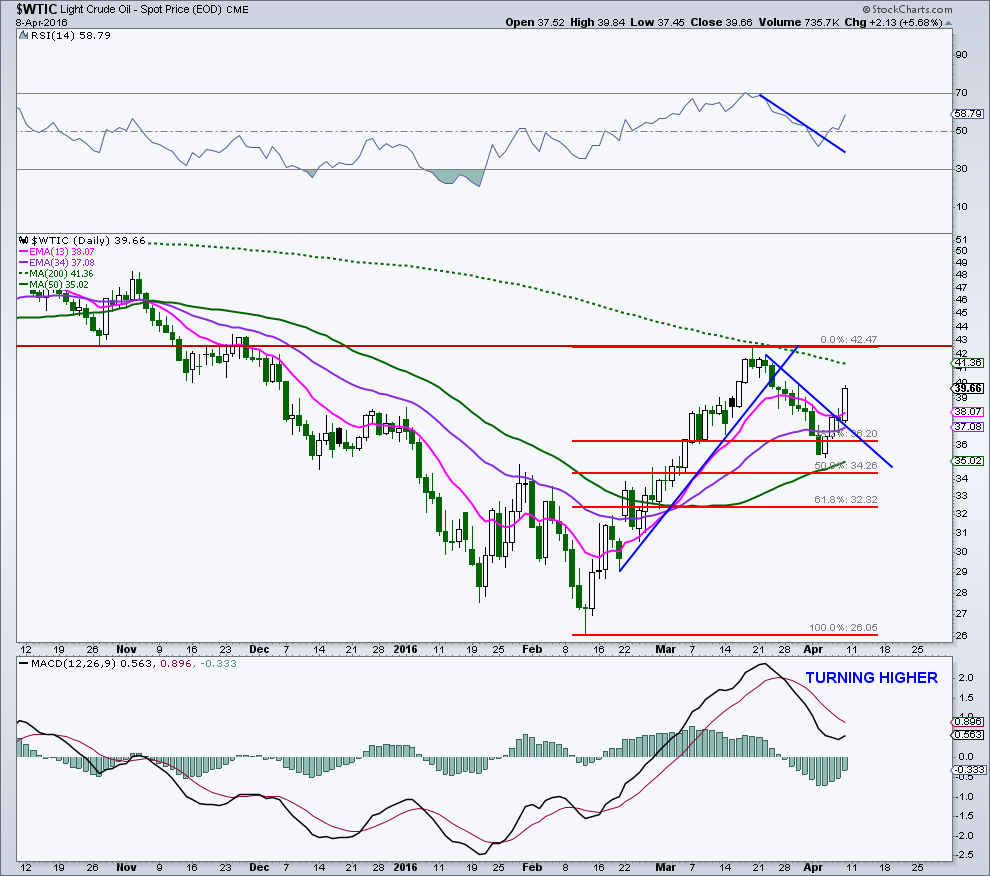
It appears that the pullback in crude oil is over and I think price will run to new recovery highs. The recent slide has worked off daily overbought momentum readings on the 14-day RSI, setting the stage for another move higher. The daily MACD remains in positive territory and is starting to turn higher.
Here’s the daily chart for WTI Crude Oil Prices (spot):
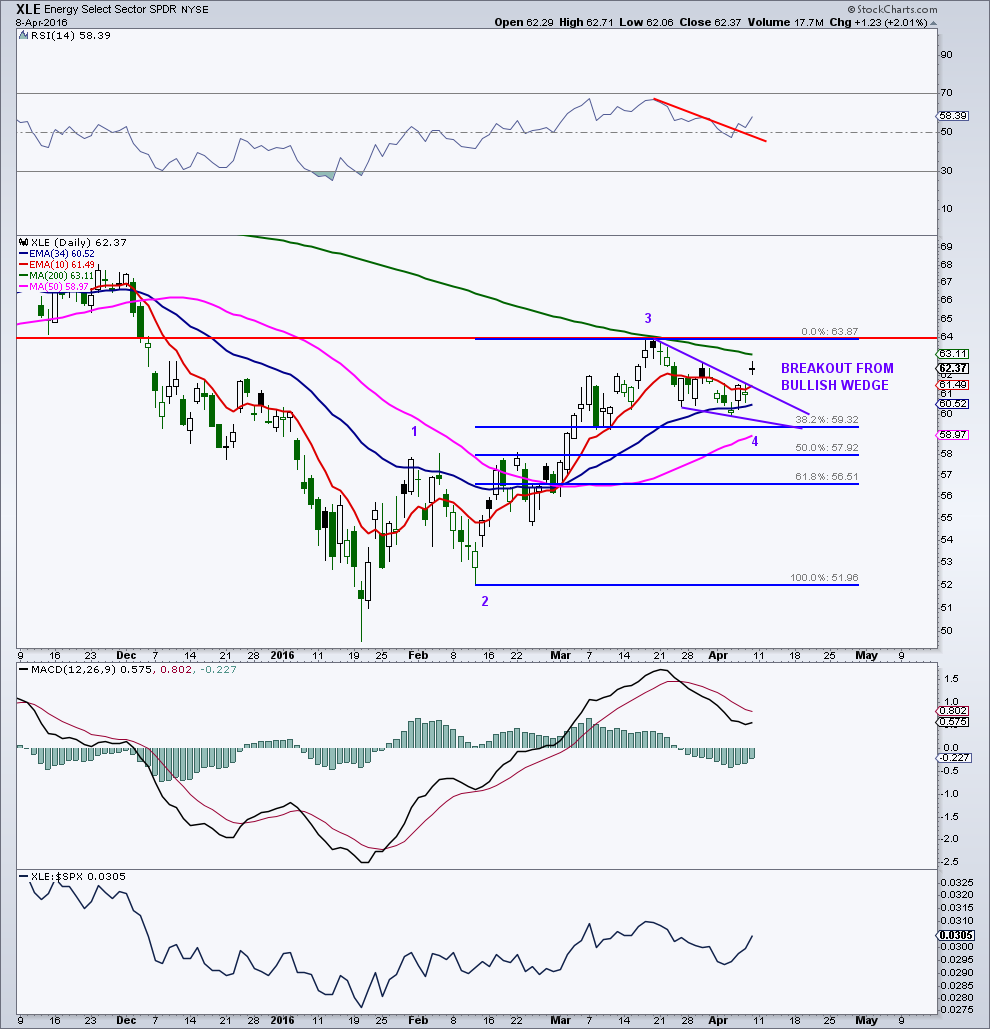
Next, let’s turn to the XLE, the broad sector ETF for energy stocks.
On the first daily chart below, the XLE has broken out of a bullish wedge and looks like Wave 4 is complete. I am targeting the 67 to 70 area for Wave 5. The 14-day RSI has broken its downtrend while the daily MACD is curling higher. XLE is starting to outperform the S&P 500 again, another bullish sign.
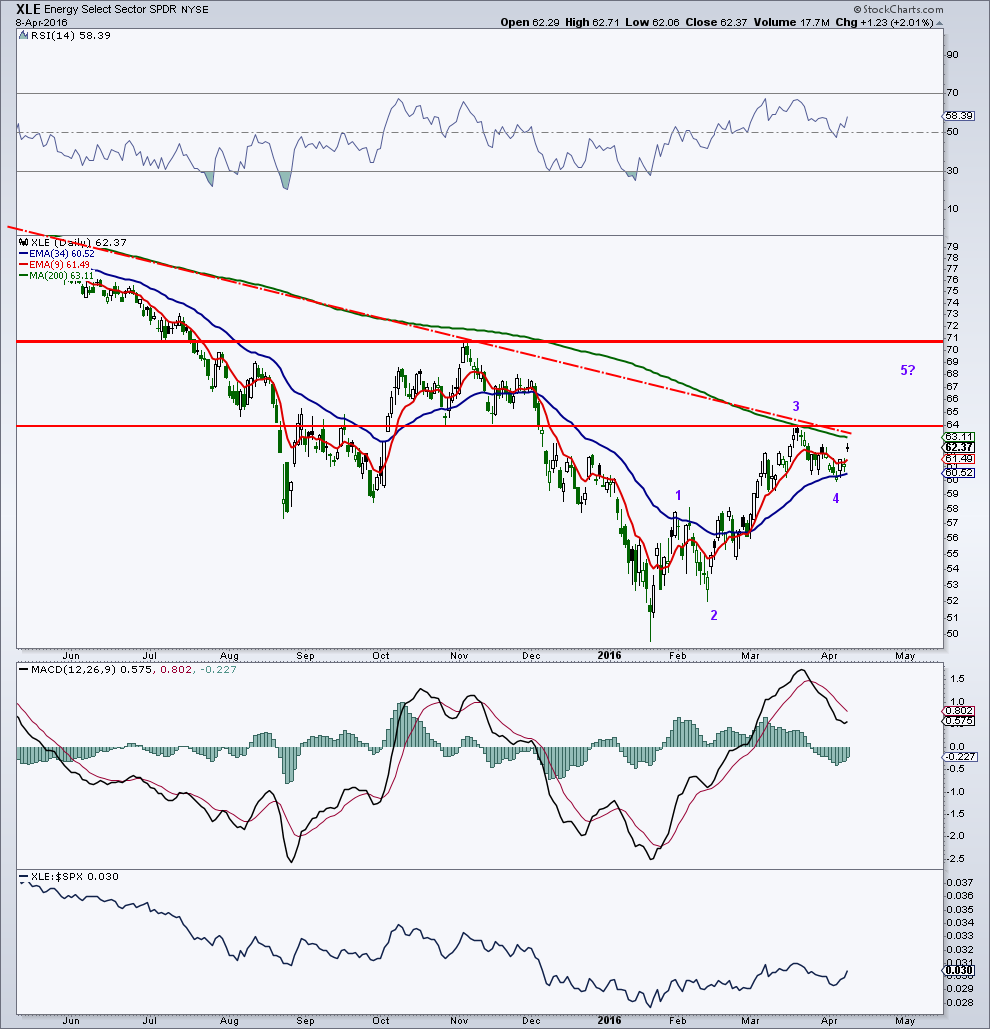
On the second XLE chart below, there are some obstacles just overhead. Both the 200-day average and trendline resistance come in just above the 63 level, with chart resistance and the recent high near 64. It would certainly be more bullish for XLE (and select energy stocks) to push through the 200-day as it has capped every rally since the major oil breakdown in 2014.
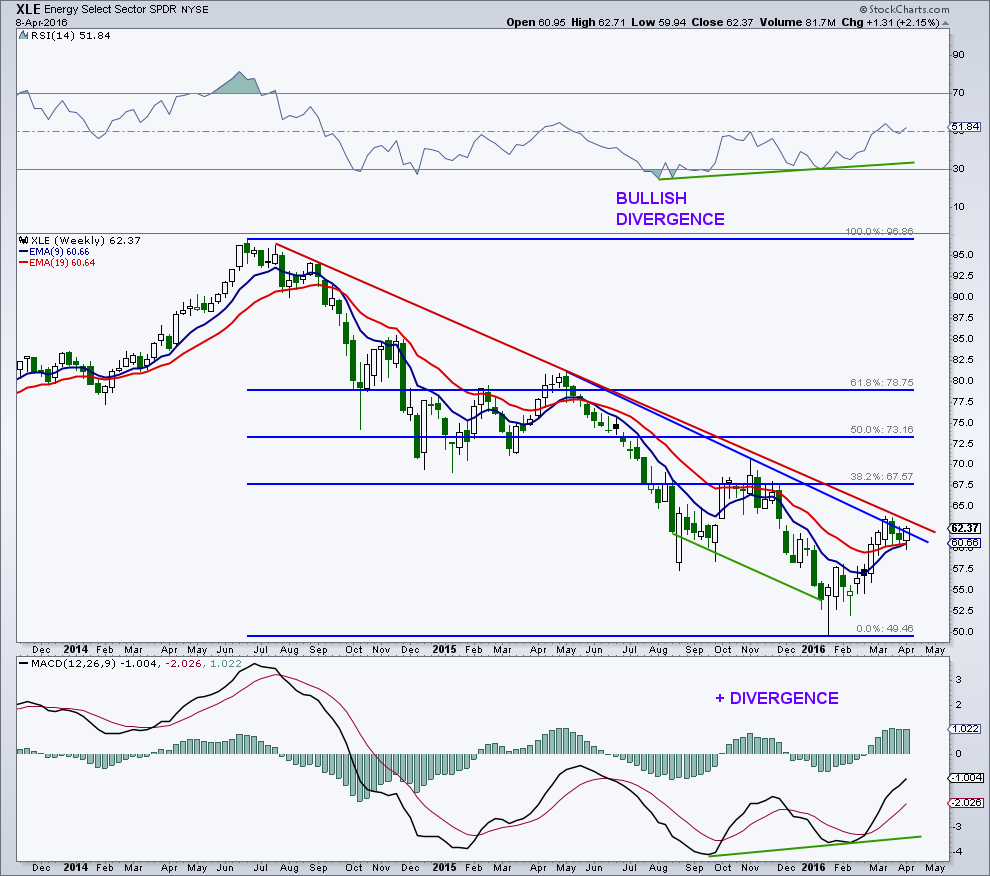
On the weekly XLE chart, price is pressing up against some key bearish trendlines. There were some bullish weekly momentum divergences at the recent lows, so I think XLE busts through these pieces of resistance and aids energy stocks in general. An initial 38.2% retracement of the entire bear market sits up in the 67/68 area and is also a potential targeted level.
You can contact me at arbetermark@gmail.com for premium newsletter inquiries. Thanks for reading.
Twitter: @MarkArbeter
The author does not have a position in the mentioned securities at the time of publication. Any opinions expressed herein are solely those of the author, and do not in any way represent the views or opinions of any other person or entity.


