The lower high we’ve been expecting in crude oil futures might have happened last week. If confirmed, it would boost the case for a strongly downward trajectory in oil prices heading into spring 2024.
The alternative near-term bullish scenario would allow for one more new high above that of September 28 before the decline begins.
For the preferred bearish scenario to work, we’d like to see price stay beneath the resistance level at 89.93. The level has already been tested once with last week’s high, which we are tentatively marking as sub-wave ‘ii’ of (c) of [ii]. This wave count is supported by an examination of price movement on daily and intraday charts not shown here.
Going forward, the best confirmation of the bearish wave count will be a strong sub-wave ‘iii’ decline during the next one or two months. A preliminary target zone for sub-wave ‘iii’ waits near 61.79 and 60.17. It would be reasonable to expect the entire wave (c) of [ii] decline to reach closer to 53.50, although we have also marked lower support zones that could come into play.
The challenge for bears will be to find good entries that will leave them more immune to the whiplash effects of fast bounces during the decline. Such bounces are to be expected in the current geopolitical environment, so bears should exercise patience in watching for opportunities on weekly, daily and intraday time frames.
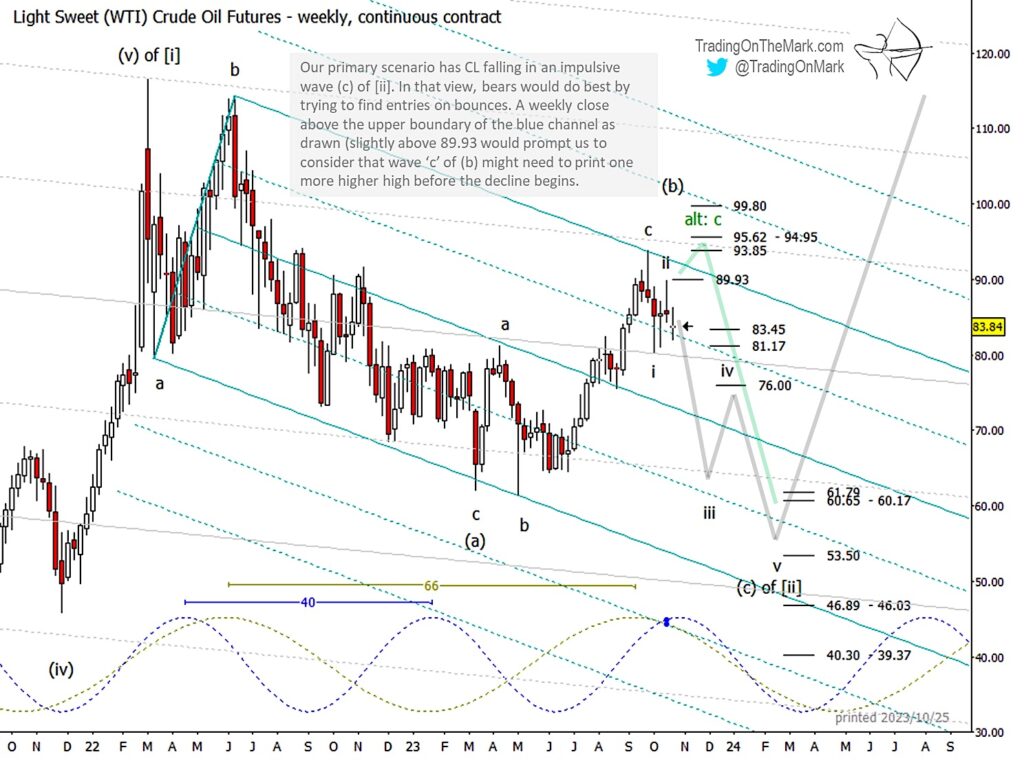
The alternative near-term bullish scenario is shown with the green path on the chart. Even though it’s not preferred, the bullish view remains viable as long as price remains above the pale gray trend line that’s shown on the chart slightly beneath 81.17 support level. (The trend line is actually the boundary of a larger channel that dates back to 2009.) A weekly close beneath the gray boundary and particularly a weekly close beneath 76.00 would render the bullish scenario much less likely.
Trading On The Mark uses technical analysis to identify the trends and turns in highly traded markets for commodities, energy, currency, bonds and indices. Visit our website for more charts, and follow us on X for updates and special offers.
Twitter: @TradingOnMark
The authors may have a position in the mentioned securities at the time of publication. Any opinions expressed herein are solely those of the author, and do not in any way represent the views or opinions of any other person or entity.

: Worrisome to Broader Market?")
