With oil prices being so volatile, we wanted to call attention to the possibility of a tradable low nearby.
In this post we look at the crude oil crash and describe some of the conditions to watch for in identifying a trading low.
In the final weeks of 2018 we showed an Elliott wave chart for crude oil via the United States Oil Fund NYSEARCA: USO.
At the time we projected a zigzag upward path going into 2019 followed by a deep decline. That scenario matched what actually transpired, and the pattern might now be nearing completion.
Crude Oil Prices Nearing a Sweet Spot
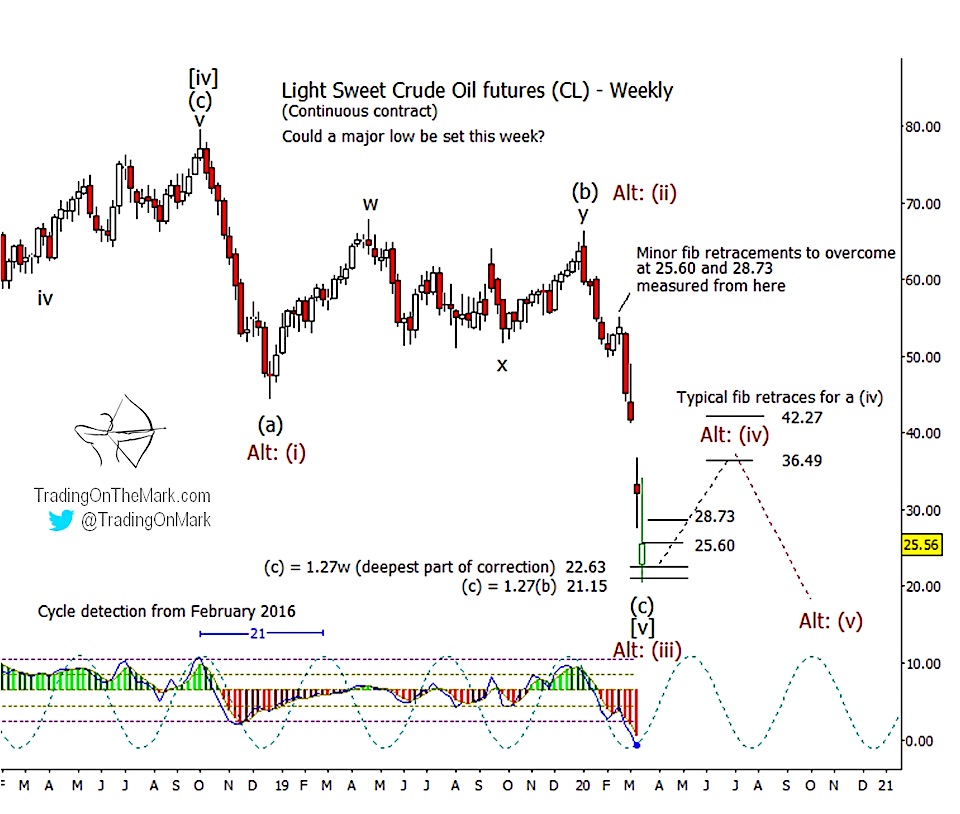
The chart in today’s post shows some price areas to monitor in crude oil futures.
For traders, the most important feature of the current chart is the five-wave impulsive nature of Crude Oil’s price decline from January. The structure might require a few more days or weeks to complete, and it should be followed by a substantial rally or perhaps a real reversal.
The futures chart shows two scenarios for crude oil, but we might have to wait through much of 2020 to discover which one is operative. Regardless of the larger wave count, any near-term signals of a rally will be essentially the same when the current five-wave decline completes its final steps.
This week futures tested an important support area near 22.63 and 21.15, levels that are based on Fibonacci relationships among the moves that are large enough to label on a weekly chart. Price has begun an initial rebound, and we’re watching for signs indicating whether that rebound is the start of the next phase of the pattern or is merely a small fourth wave within the five-wave decline. Seeing a breach of 28.73 and ideally a weekly close above that level would give preliminary confirmation that a new low won’t be needed this spring.
In terms of watching for nearby trading signals, it shouldn’t matter which of the two scenarios on our chart is really in control. However the question will influence how traders might plan to exit or manage their trade in coming months though.
Our primary scenario treats the decline in crude oil prices from 2008 as a lengthy ending-diagonal pattern. (See this link for an explanation of ending diagonals and how they behave.) A diagonal has five waves, each containing three sub-waves. Our primary scenario treats the three-part decline from October 2018 as the fifth and final wave of the diagonal. In that view, the decline should be nearly complete, and no major new low is needed after price climbs out of the current hole.
The next-best scenario, our alternate, would see a five-wave impulsive structure down from the 2018 high. In that view, a rebound from the present area would represent the fourth wave in the five-wave decline.
The key test to distinguish between our primary and alternate scenarios is whether price can rise above the area that would normally cap an internal fourth wave. If CL can break the Fibonacci-based retracement resistance levels at 36.49 and 42.27, that would give preliminary confirmation of the primary scenario. The same levels would lead to a downward reversal to a new low if our alternate scenario is playing out.
Trading On The Mark provides detailed, nuanced analysis for a wide range of markets. With a Daily Analysis subscription, you get twice-daily updates for heavily traded markets including the Euro, gold, crude oil, bonds and the S&P 500. The Intraday Analysis subscription offers additional moment-by-moment coverage.
Twitter: @TradingOnMark
The authors may have a position in the mentioned securities at the time of publication. Any opinions expressed herein are solely those of the author, and do not in any way represent the views or opinions of any other person or entity.


