It was a big week for the Crude Oil bulls, as West Texas Intermediate (WTI) broke out from a triangle or bullish pennant formation. The rally pushed crude oil prices right up into two more pieces of key resistance. Let’s review the technical picture for crude.
For those of you tracking at home, feel free to read my last crude oil post from late August: “An Oil Gusher: How Crude Oil May Have Drilled Out A Bottom“.
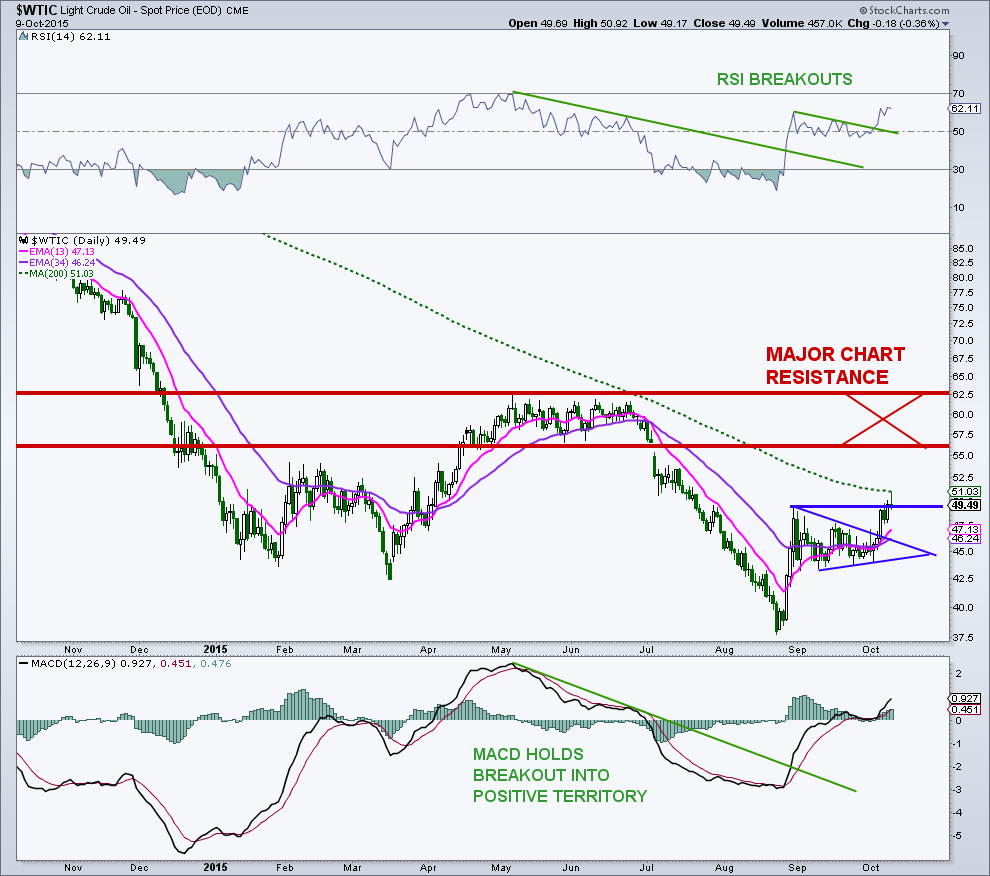
The first key hurdle in crude’s intermediate-term bottoming process is the recent high at $49.33/barrel, which was slightly eclipsed on Friday.
WTI also ran right up to its flattening 200-day simple moving average at $51/barrel on Friday before pulling back. These resistance levels will be important to watch.
During the bottoming process, which started in August, daily momentum has traced out a higher high and higher low. The daily MACD has cycled back into bullish territory and is holding for the first time since April. We also have a bullish moving average crossover with the 13-day exponential jumping back above the 34-day exponential average, also for the first time since April. Based on the size of the bullish pennant, I think crude oil prices are on their way up to what appears to be a pretty stiff region of overhead supply that sits between $56.50 and $62.60/barrel.
While early, it is possible that WTI is tracing out a very large inverse head-and-shoulders formation with the left shoulder and head in place. If this is correct, a failure in the overhead supply area followed by a right shoulder would be something to look out for. One key reason that I have been bullish on crude oil is due to the fact that from the middle of May until the middle of August, commercial hedgers had raised their net futures position in crude, while large speculators had cut their net exposure to the crude futures market. This combination of COT data looked similar to the data earlier this year when crude was bottoming.
However, over the past two months, this pattern has reversed a bit, which may also suggest that any strength into the noted overhead supply will fail. Over the decades, watching the COT data for crude has been very valuable in aiding oil forecasts.
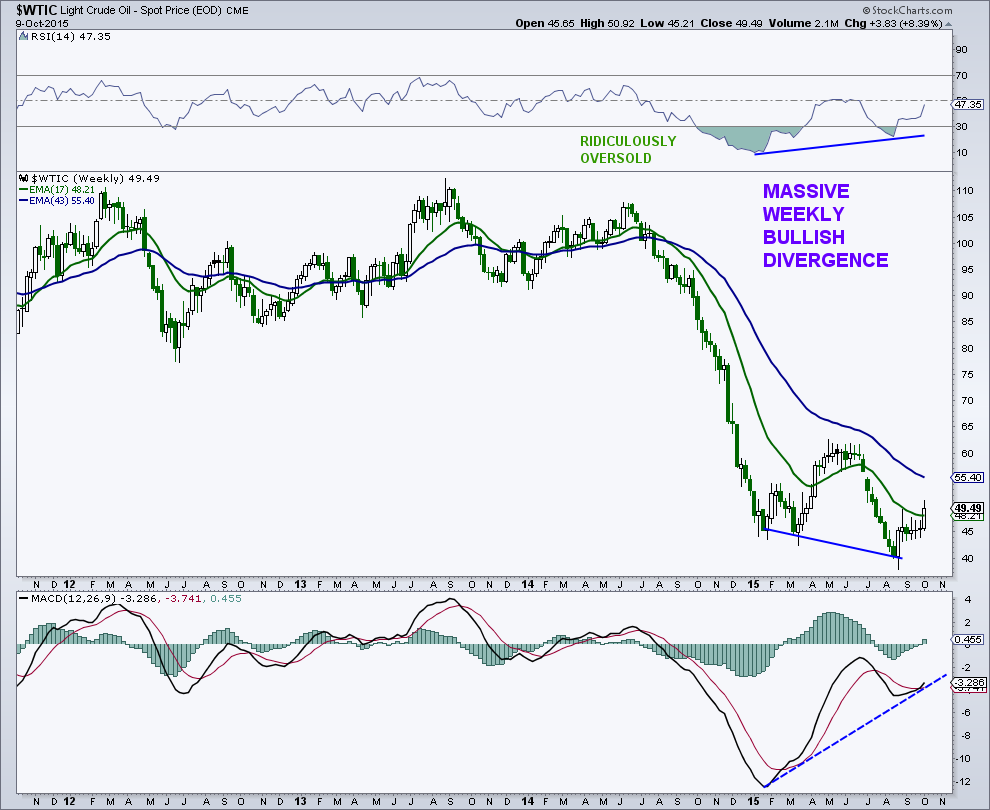
A quick look at the weekly chart for crude oil shows the massive weekly momentum divergences that have been traced out on the 14-W RSI and weekly MACD. While these weekly bullish momentum divergences are frequently seen during longer term bottoms, the chart also shows that the 17W EMA remains well below the 43W EMA and that both averages are still declining, although the 17W is flattening. From a longer term perspective, WTI still has plenty of work to do before another long lasting uptrend can take shape.
On the monthly WTI chart, a bullish momentum divergence is in the works on the RSI, after cycling into oversold territory.
continue reading about crude oil prices on the next page…


