With the “big bad event” that was the payroll number out of the way, it’s worth recapping the state of the corporate credit markets particularly in light of some recent moves. First, a quick reminder of why Brian Reynolds (now at New Albion Partners) views corporate bonds and equities as being tied to the hip:
- Pensions and foundations are wildly underfunded and to cover such gap they have two basic options: raise contributions from their participants and shoot for higher than market returns. Just anecdotally, subsequent to the Illinois Supreme Court decision holding that changes to the state’s pension funds are unconstitutional, IL and the city of Chicago must come up with a plan to plug pension holes of more than $120B.
- Pensions and foundations currently have target returns of 7.5-8% on their money;
- Achieving those returns within fixed income on an unlevered basis in the current interest rate environment is impossible, and pension Boards want little to do with equities;
- Therefore the pensions hand money over to leveraged bond funds which put the money to work at 5x-7x leverage right off the bat (probably on its way to 30x and 40x as we saw at the peak of the last bubble). Lately a fair amount of the allocations have also targeted commercial real estate where leverage still remains within reasonable levels (max. of 65% LTVs), but it allows for IRR targets in the low teens at the expense of liquidity;
- Companies sell corporate bonds to these funds and use the proceeds for buybacks and M&A. Recall that on a net basis, the Federal Reserve Z.1 release shows that over the last 6 years (at least) the only buyers of stocks are the companies themselves. All other participants in the equity markets either trade stocks among themselves or, in the aggregate, they are net sellers.
So, starting at the beginning of the above food chain, here is what the most recent important data shows:
– Based on the information published in Pension & Investment Magazine, the month of May saw the largest amount of new allocations to corporate bonds and CRE I can remember for a 1 month period: $12.5B and $3.1B respectively. Just for the bond portion, and assuming only 5x leverage, that’s more than $60B of new buying power in just 30 days. This is the base of the pyramid, and it has never been stronger;
– The ensuing issuance of bonds is also through the roof, and it would be higher but for a lack of supply, which is a “fat problem” to have if you are a bond seller. Last week’s new issuance was $35B, May’s was $202.1B and March through May a 3-month record of $567.5B. Companies can access the corporate bond market at will to fund the “engineering” of their stock prices;
– Despite the massive issuance, since the middle of March high yield spreads have tightened about 40bps almost in a straight line (from 480bps to 440bps). In other words, corporate bonds are in the bizarre dynamic where high supply begets higher bond prices (lower yields);
– M&A deals and buyback announcements are off the charts.
The above is all good (great?) news and it is likely to support the current secular bull market in equities for many years, or at least until the source of cash to buy bonds dries up. However, in the near to intermediate term, there are some “tells” that argue that equities may have run too far and for too long without a meaningful correction, and credit markets bears are starting to pressure corporate bond derivatives in an effort to spook the equity markets.
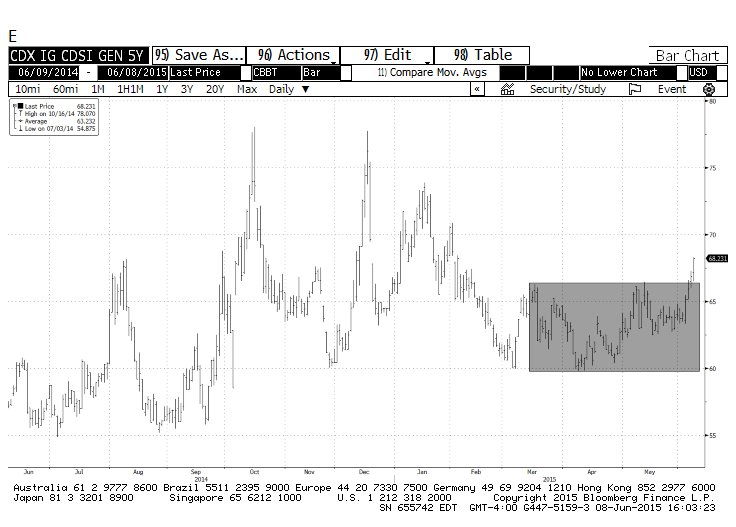
- Over the last few days, the bears’ favorite Credit Default Swaps index, the IG CDX, has broken out to the upside after spending the last 3+ months between 60bps-65bps.
- The High Yield CDX has also been widening.
- I noted earlier that High Yield spreads have been acting very well, but yesterday for the first time in a long while they widened a notable 9bps;
- CDS on subordinated debt of EU financials (presumably very sensitive to the Greece drama) also broke out to the upside of multi-month trading range;
- Not coincidentally (at least in my opinion) these moves in credit derivatives are coming about just as the S&P 500 Pit traded contract (SPA) printed a daily Perfected TD Sell Setup, a Sequential Countdown Sell (followed by a bearish “Price Flip” 3 days later), broke the TD Propulsion Momentum Down level on a qualified basis targeting a TD Prop Exhaustion Down target at 2076.05, and last night closed below the TDST Level Down price of 2080.80. These are all indicators suggesting that the buying binge is tiring out the bulls;
- On a weekly basis, DeMark indicators look much better, but the first level of support at 2083.45 has given out, and the next area is at 2034.90.
The recent deterioration in the credit markets is not the end of the world, but for traders with short to intermediate time frames it presents meaningful trading opportunities. If past is prologue, and stocks are starting a real correction, what we are likely to see is:
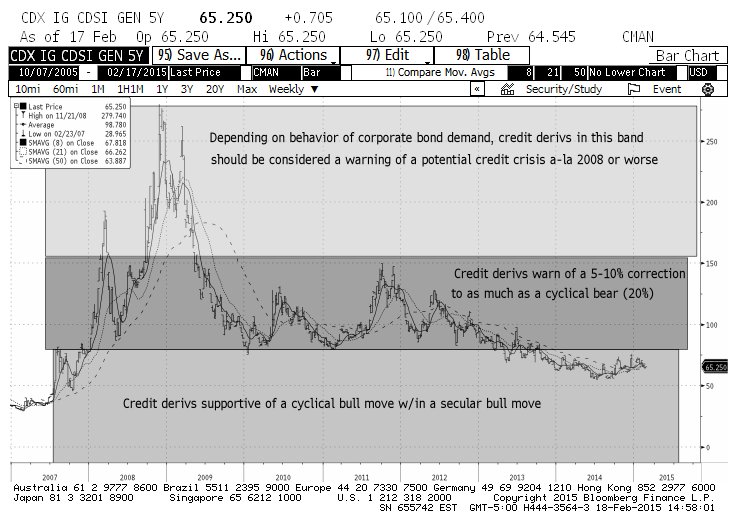
1. A continued worsening of credit derivatives. Should the IG CDX bust through the 76bps area, it may even portend a pullback similar to what happened in the summer of 2011;
2. A pause in the issuance of corporate bonds;
3. A widening of spreads;
4. gnashing of teeth that the “end is nigh”. Consider that above 1814 on the SPX Pit traded contract, in DeMark terms it would be difficult even to argue that there’s been a change of the primary trend of the current bull market. Unfortunately, the psyche of traders and investors has morphed into thinking that a drop of more than 3% is tantamount to the apocalypse.
5. Such growing angst will be reflected in an ever flattening 3-month curve of the Volatility Index, until it actually goes negative and stays there for several days.
6. The end of the swoon will likely be marked by a day of strong positive divergence between credit and stocks (the former strong while the latter weak).
As Todd Harrison once told me, the overarching question for market participants is always whether to “buy-to-sell” or “sell-to-buy”. For the last two years there has only been room for the former, except for the fastest of traders. Now, if the credit markets are in fact in the early stages of one of the many pauses we have seen since ’09, the opening for the bears may last longer than a few days.
For more frequent updates on the credit and equities you can follow me on Twitter.
Twitter: @FZucchi
The author has a position in SPX at the time of publication. Any opinions expressed herein are solely those of the author, and do not in any way represent the views or opinions of any other person or entity.
: Creating Bullish Divergence?")


 and Semiconductors (SMH): Concerning Price Pattern?")


