The broad rally in commodities prices has been very strong, taking turns heating up various commodities along the way.
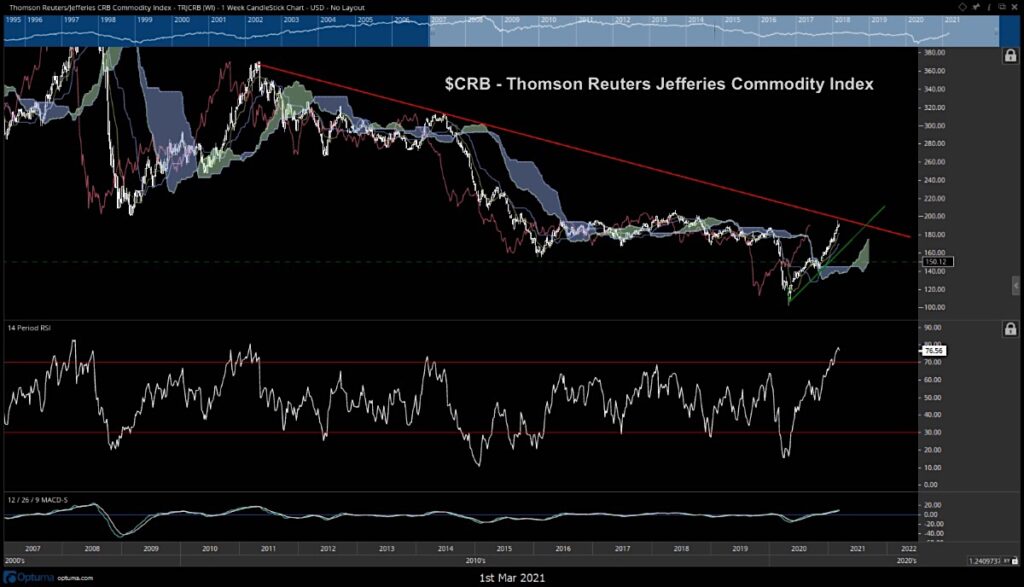
That said, the broad commodities Index, Thomson Reuters Jefferies CRB index, is now trading up at 10-year price resistance. This should result in some consolidation in the weeks ahead before commodities can continue to rally.
While the near-term push higher looks quite positive for many commodities, as a group they have neared important trend line resistance from their peak 10 years ago.
Weekly relative strength (RSI) has reached 76 which is quite overbought for weekly charts, and Monday’s rolling over in WTI Crude Oil and further compression in Gold looks important.
Thus, while a larger US Dollar breakdown should certainly help emerging markets, Materials and the commodity space, in the short run (3-5 weeks in this case) there could be some consolidation to this move before this advance continues.
Thomson Reuters Commodities Index (CRB) Chart
If you have an interest in seeing timely intra-day market updates on my private twitter feed, please follow @NewtonAdvisors. Also, feel free to send me an email at info@newtonadvisor.com regarding how my Technical work can add alpha to your portfolio management process.
Twitter: @MarkNewtonCMT
Author has positions in mentioned securities at the time of publication. Any opinions expressed herein are solely those of the author, and do not in any way represent the views or opinions of any other person or entity.


