Maybe it’s just Valentine’s Day so the food and commodities market sees a push to chocolates, flowers, and fine dining.
And maybe not.
The CPI came out with an unexpected rise…but goods remained softer. Services on the other hand, rose.
However, the CPI excludes food and energy prices.
We see no relief in many of the agricultural commodities in the Investor DB Agricutural Fund ETF.
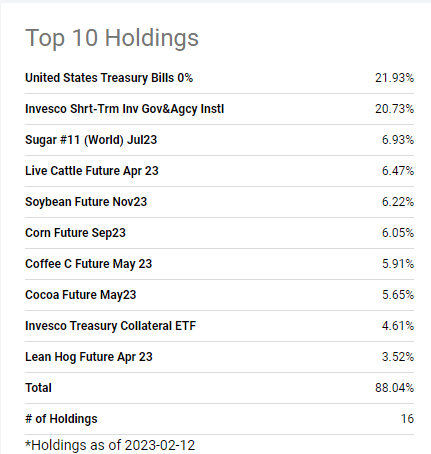
The underlying index includes corn, soybeans, wheat, Kansas City wheat, sugar, cocoa, coffee, cotton, live cattle, feeder cattle, and lean hogs and most recently livestock.
The investment seeks to track changes, whether positive or negative, in the level of the DBIQ Diversified Agriculture Index Excess Return™ (the “index”) over time, plus the interest income from the Fund’s holdings of primarily US Treasury securities and money market income less the Fund’s expenses.
If you want to track how the Fed is doing controlling real inflation, regardless of the inverted yield curve, the rise in long bond yields or even the U.S. dollar holding support…
Before we review the chart, our quant models have lots of commodities holdings. Particularly the Sector Conservative, Sector Moderate and GEMS models hold metals and oil exploration. Interestingly, we also hold SOXL or the 3 times leveraged Semiconductor bull (since January 11th).
Chips and commodities are where its at right now. That makes chips as valuable as say, sugar (one of the largest holdings in DBA)
And speaking of sugar, the futures are holding recent highs. Another blast higher in sugar and more chaos could ensue as we have written about many times. Here is a timely article written in April 2020!!!
The CPI number excludes food. However, to date, while food prices have declined from the peak in July 2022, food inflation sits at 10%. Food at home is 11.3% and food away from home at 8.2%.
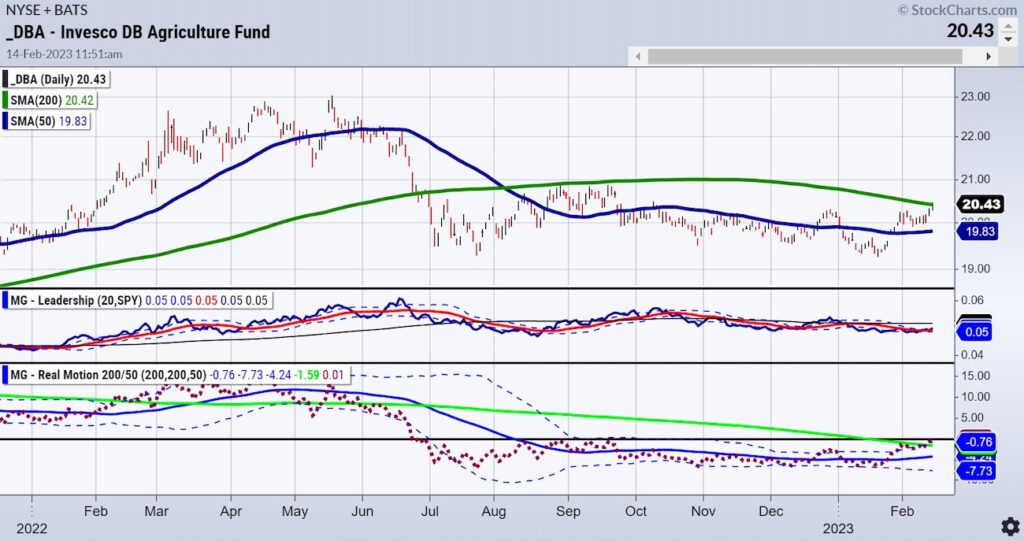
Circling back to the DBA chart.
The price rose to clear all of the prior action since October 2022. However, the 200-day moving average looms large as resistance with today’s high.
Also noteworthy is that DBA is now outperforming the benchmark according to our Leadership indicator.
Real Motion had a breakout and diversion to the upside as the momentum cleared over the 200-DMA and popped to new highs not seen since last September. The diversion is that the momentum indicator cleared the 200-DMA while price has yet to confirm. Something to watch out for.
With the four indices still rangebound, these continuing bullish trends in the most essential thing on the planet-FOOD-should keep those focusing on A) disinflation and B) A fed pivot a bit quieter.
Stock Market ETFs Trading Analysis & Summary:
S&P 500 (SPY) 420 resistance with 390-400 support
Russell 2000 (IWM) 190 pivotal support and 202 major resistance
Dow (DIA) 343.50 resistance 338 support
Nasdaq (QQQ) Nice comeback-still 2 inside weeks working so watch 311 as a good point to clear or fail from
Regional banks (KRE) 65.00 resistance 61 support
Semiconductors (SMH) 248 cleared with the chips rout-254.60 last week’s high
Transportation (IYT) The 23-month MA is 244-now resistance 228 support
Biotechnology (IBB) Sideways action 130-139 range
Retail (XRT) 78.00 the 23-month MA resistance and nearest support 68.00
Twitter: @marketminute
The author may have a position in mentioned securities at the time of publication. Any opinions expressed herein are solely those of the author and do not represent the views or opinions of any other person or entity.


