Commodities started off the year strong but as the crop reports started rolling in of the bumper crop that was expected for this year, prices began to fall a couple months ago. We now have some futures markets sitting near multi-year lows, which means it might be time to start looking for interesting setups. With that, I think Cotton prices may be ready to start putting in a bottom.
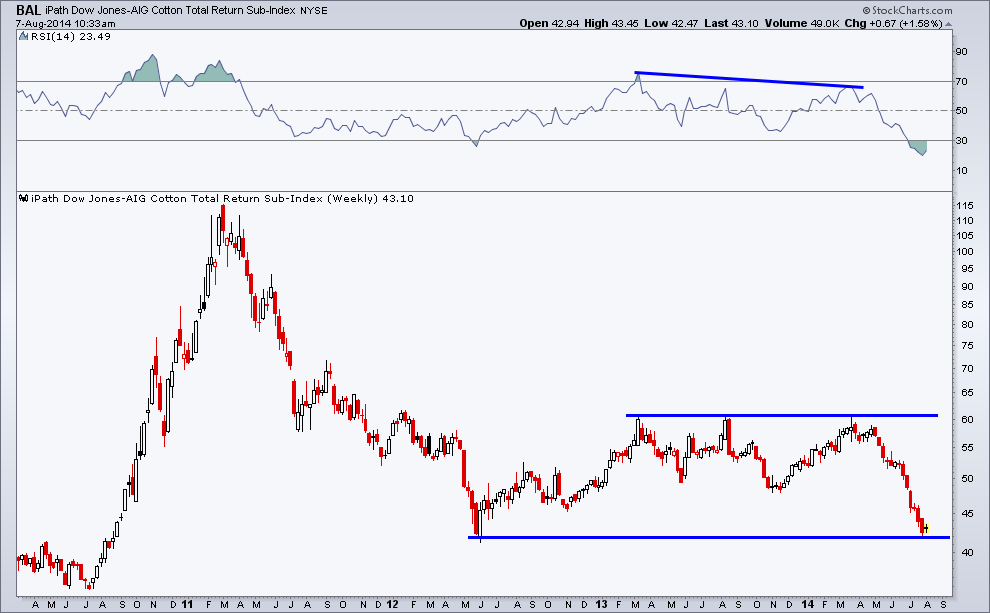
The iPath Cotton ETF (BAL) has fallen 30% from its 2014 high as it drops down to its prior 2012 low at $42. Cotton prices fell nearly 60% from the 2011 high before putting in a bottom in 2012. This creates a large channel if we see prices rise from here. If price were to break out, the move could be fairly large coming off of a multi-year congestion period.
Going into the 2014 high we saw that momentum was unable to maintain strength, creating a negative divergence while price battled the 2013 high at $60. This bearish divergence of lower highs was a good signal that trouble may be ahead based on this weekly chart. The Relative Strength Index is now at extremely low levels as sellers have not taken their foot off the gas pushing prices lower over the last seven consecutive weeks. Has the momentum rubber band become overly extended to the downside?
Cotton ETF (BAL) Weekly Chart
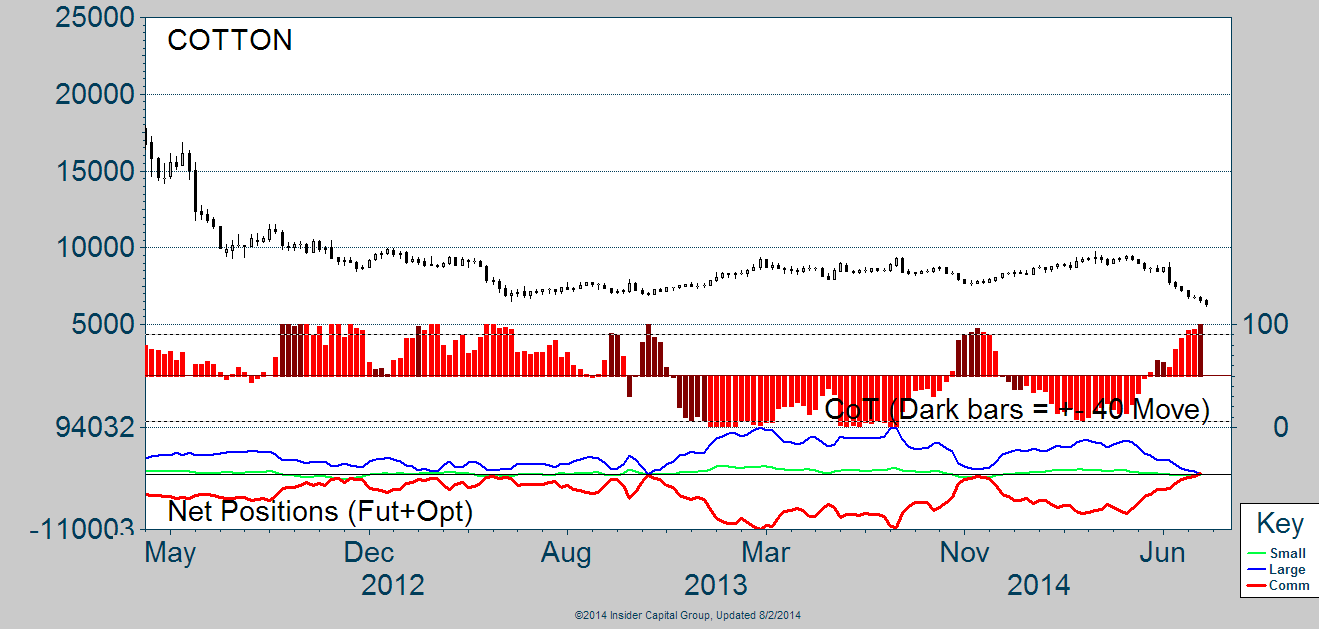
Next we have a chart of the latest Commitment of Traders data for Cotton Futures (CT_F) contracts. What we want to focus on today is the blue and red lines. The blue lines represent Large Traders, which are often trend followers, hedge funds, or large institutions. While the red line represents Commercial Traders, which are often considered the ‘smart money’ since this group is made up of companies that deal within that commodity, think of Monsanto, farmers, Tyson Foods, etc. Commercial Traders are often net-short commodities as they are using the futures market to hedge their exposure to change in prices for other parts of their business. If the price of Cotton were to fall, that could have an impact on a company’s margins so they can hedge their exposure by shorting Cotton.
However, every once in a while we see Commercial Traders become close to becoming or actually net-long a commodity, and when this happens a change in trend often follows. This is what’s taken placing right now in Cotton, and it has only happened a hand full of times over the last several years. Commercial Traders have become net-long Cotton futures while Large Traders, which often remain net-long the Cotton market, have become net-short. We saw something similar happen in late 2013 before cotton saw a multi-month rally and again in 2012 when Cotton was last at the price it is now.
Commitment of Traders Chart – Cotton
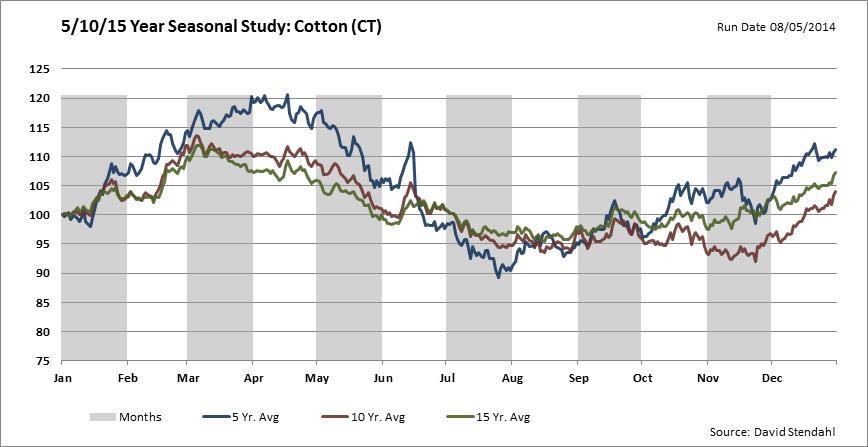
So we know that price is at potential support and the ‘Smart Money’ has become net-long futures contracts, but what does seasonality have to say about the trend in Cotton Prices. Based on the 5-, 10-, and 15-year historical trends in Cotton, we have often seen a low put in in late-July or early August. We can see that the bottom in seasonal trends has been moving closer to late-July as the 15-year and 10-year patterns bottoms in mid-August, while the 5-year Seasonality trend puts in a low in late-July. With prices rising based on seasonality into year-end, it appears history favors the bulls going forward for cotton prices.
Seasonality Chart – Cotton Prices
One of the things I love about technical analysis is when you can see multiple sets of data begin to line up. First we look at price finding support with potentially over-extended momentum, and then we find that Commercial Traders are also beginning to show a stronger interest which has been historically bullish, followed by the seasonal trends indicating that bottom has typically been formed during this time of the year. Now this doesn’t mean prices are required to rise from here, if $BAL were to fall under the 2012 low then it’s possible we head to the low prior to the large advance in 2010, which is another 15% lower. If price does advance then I’ll be watching to see if it can get back to the prior 2014 high and give another test of resistance.
The information contained in this article should not be construed as investment advice, research, or an offer to buy or sell securities. Everything written here is meant for educational and entertainment purposes only. I or my affiliates may hold positions in securities mentioned.
Any opinions expressed herein are solely those of the author, and do not in any way represent the views or opinions of any other person or entity.

: Cup (and Maybe Handle) Watch")
 Reaches Important Price Support")

