The following chart and data highlight non-commercial commodity futures trading positions as of May 8, 2018.
This data was released with the May 11 COT Report (Commitment of Traders). Note that this chart also appeared on my blog.
The chart below looks at non-commercial futures trading positions for the U.S. Dollar. For the week, the U.S. Dollar Index rose +0.2%.
Here’s a look at U.S. Dollar Index futures speculative positioning. Scroll further down for commentary and analysis.
U.S. Dollar Index Futures: Currently net short 549, down 1.2k
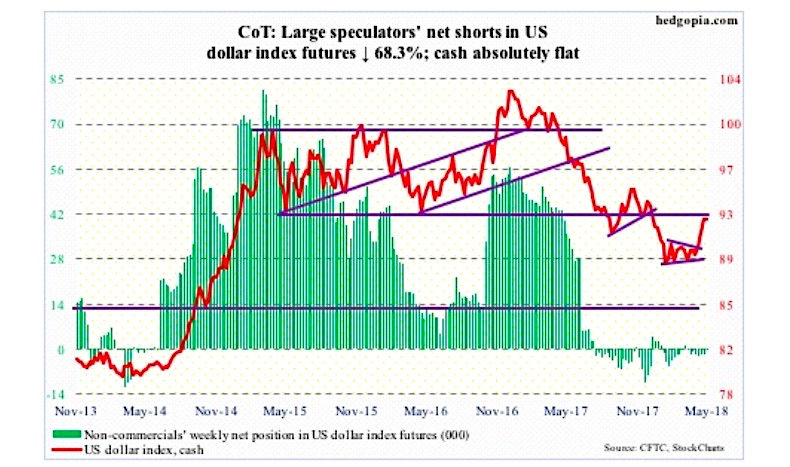
The U.S. Dollar “cash” Index continued to attack the 92-93 area – an important price point going back to at least 1998 – but at the same time gave out further signs of fatigue.
Wednesday produced a long-legged doji, followed by down Thursday and Friday. The 200-day (91.84) lies below.
The latest rally precedes a symmetrical triangle breakout three weeks ago. This was preceded by persistent defense of long-term support at 88-89.
Non-commercials pretty much sat out the entire rally.
Near term, besides 91, there is support at 90.30-ish.
Twitter: @hedgopia
Author may hold a position in mentioned securities at the time of publication. Any opinions expressed herein are solely those of the author, and do not in any way represent the views or opinions of any other person or entity.

: Showing Some Signs of Emerging Strength")
