The chart and data that follow highlight non-commercial commodity futures trading positions as of September 4, 2018. This data was released with the September 7, 2018 COT Report (Commitment of Traders).
Note that this chart also appeared on my blog.
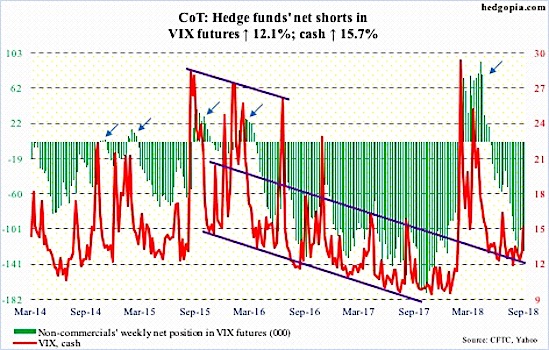
The chart below looks at non-commercial futures trading positions for VIX Volatility Index futures. For the week, the VIX Volatility Index (INDEXCBOE:VIX) finished up +15.7%.
Here’s a look at VIX Volatility futures speculative positioning. Scroll further down for commentary and analysis.
The VIX has perked up of late with stocks declining last week (see comments below).
Let’s look at the COT data and technical to see what’s next…
VIX Volatility Index Futures: Currently net short 127.1k, up 13.7k.
The VIX may be signaling a bullish crossover on the intermediate (weekly) chart. The last time this occurred was January of this year. And considering that the VIX Volatility Index rose over 15 percent this week alone, investors ought to pay attention. The chart is showing more room to rally, but that can only occur should if conditions dictate.
Elsewhere, the twenty-one day moving average on the CBOE equity put-to-call ratio has been under upward pressure hitting recent lows August 30. The put-call ratio could rise to near 0.70 before oversold conditions are accounted for.
Twitter: @hedgopia
Author may hold a position in mentioned securities at the time of publication. Any opinions expressed herein are solely those of the author, and do not in any way represent the views or opinions of any other person or entity.


